Team:EPF-Lausanne/Modeling
From 2008.igem.org
(→Simulation) |
(→Simulation) |
||
| Line 38: | Line 38: | ||
====Simulation==== | ====Simulation==== | ||
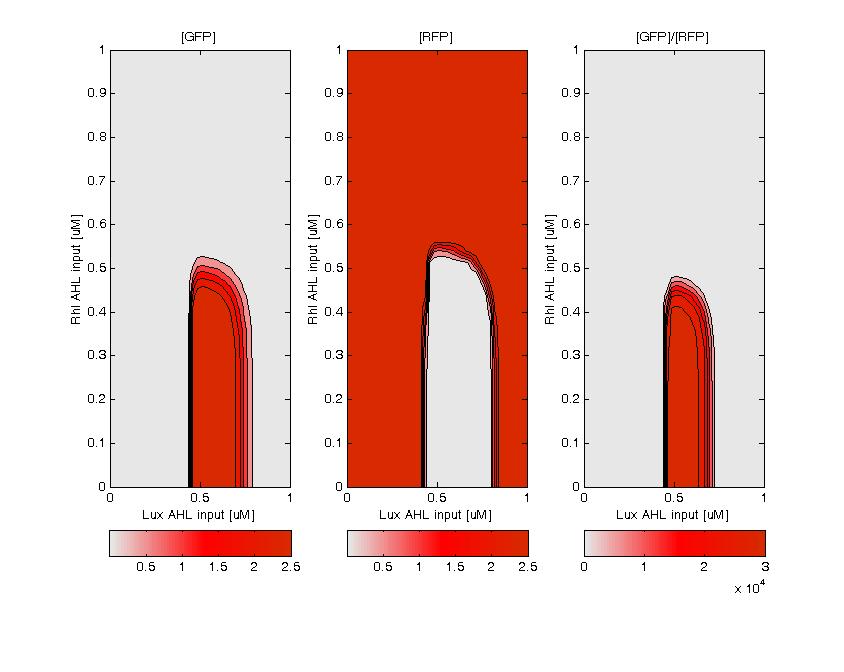
| - | [ | + | [GFP (left) and RFP (middle) expression for concentration of AHL (Lux or Rhl) pulses. On the right, figure shows the ratio of GFP/RFP. |
| - | + | [Image:bistabl_sim.jpg]] | |
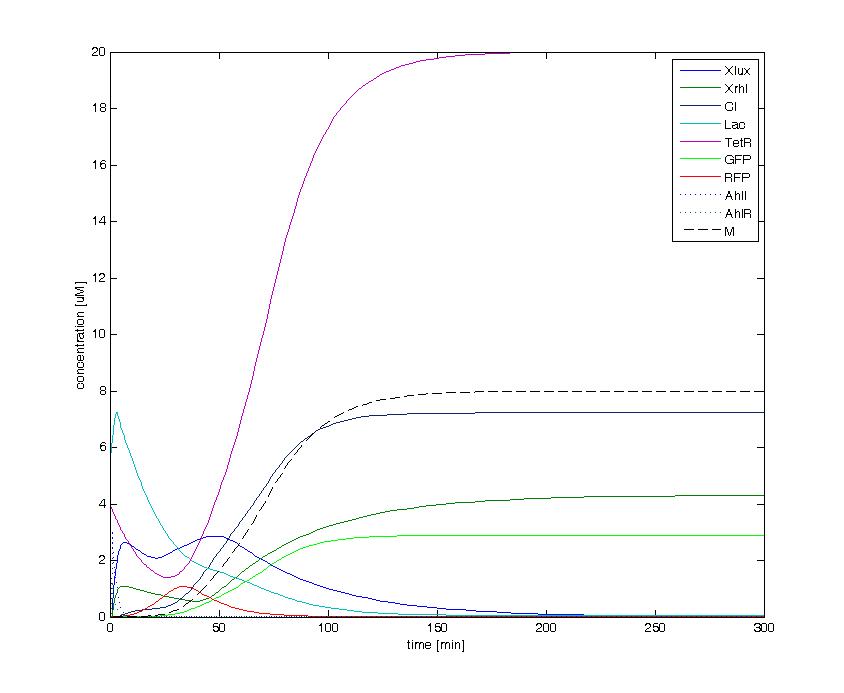
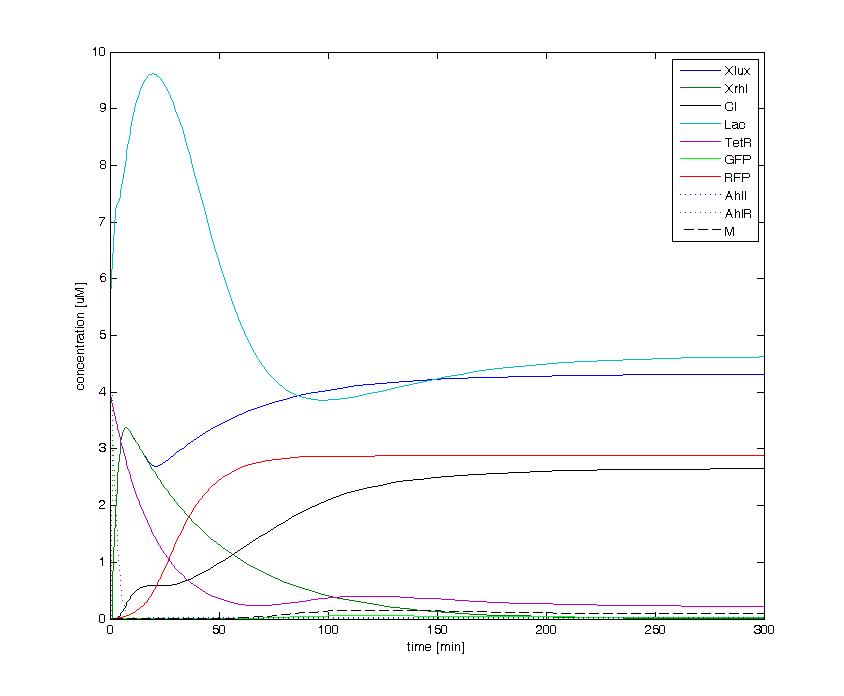
| - | [[Image:green_state_1-6_3.jpg| | + | The following figures show the dynamics of the different states involved in the system for different AHL pulses. On the left, the system is locked into the green state after a pulse of 1.6 uM of Lux AHL and 3 uM of Rhl AHL. On the right, the system is locked into the red state after a pulse of 4 uM of Lux AHL and 4 uM of Rhl AHL. The model nicely shows the dominance of either TetR or LacI for the green, respectively red state. |
| + | |||
| + | |||
| + | [[Image:green_state_1-6_3.jpg|400px]] [[Image:red_state_4_4.jpg|400px]] | ||
Revision as of 16:54, 29 October 2008
| Home | The Team | The Project | Parts | 2-step PCR | Microfluidics | Modeling | Notebook |
|---|
Contents |
Double input model
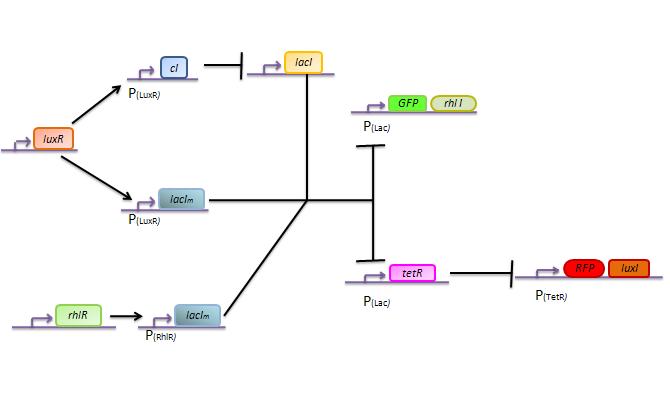
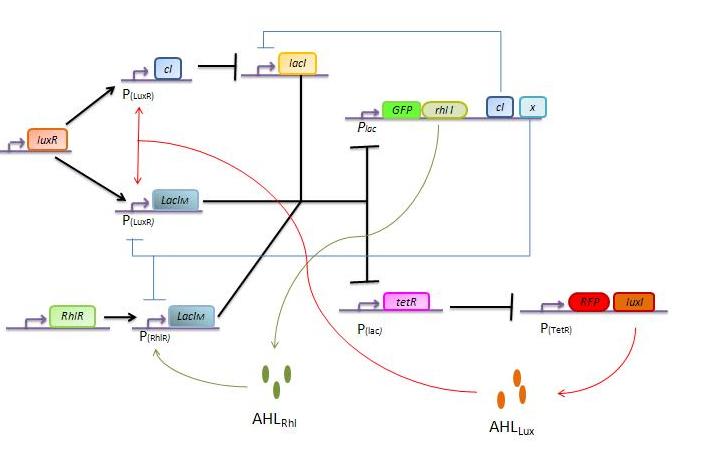
Here we describe a semi-quantitative model of the Lux band-pass detector and the Rhl high-pass detector. The model describes each proteins and sending molecules involved in the system.
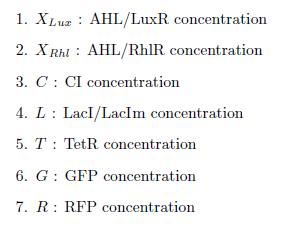
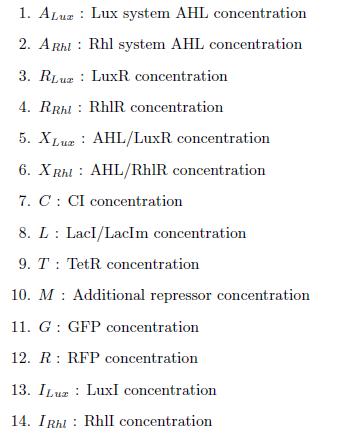
States
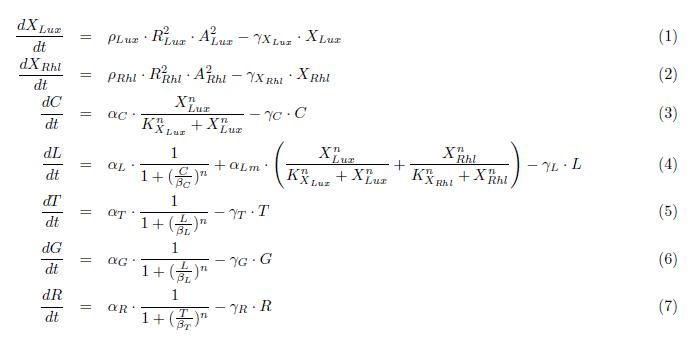
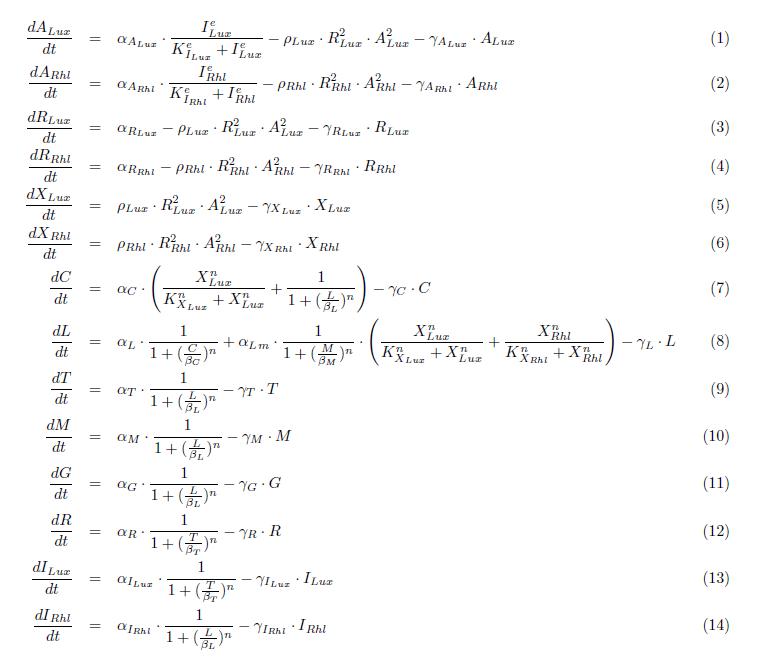
ODEs
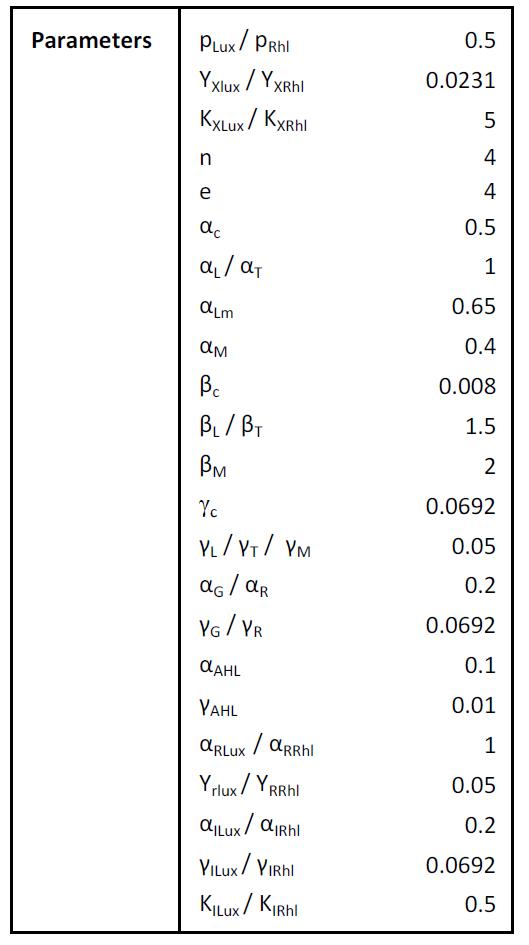
Parameters
Simulation
Bistable switch model
States
ODEs
Parameters
Simulation
[GFP (left) and RFP (middle) expression for concentration of AHL (Lux or Rhl) pulses. On the right, figure shows the ratio of GFP/RFP.
[Image:bistabl_sim.jpg]]
The following figures show the dynamics of the different states involved in the system for different AHL pulses. On the left, the system is locked into the green state after a pulse of 1.6 uM of Lux AHL and 3 uM of Rhl AHL. On the right, the system is locked into the red state after a pulse of 4 uM of Lux AHL and 4 uM of Rhl AHL. The model nicely shows the dominance of either TetR or LacI for the green, respectively red state.
 "
"
