Team:Imperial College/Growth Curve
From 2008.igem.org
| Line 56: | Line 56: | ||
{{Imperial/Box1|Results| | {{Imperial/Box1|Results| | ||
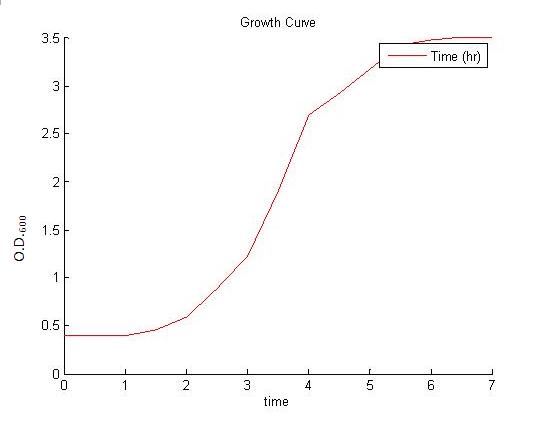
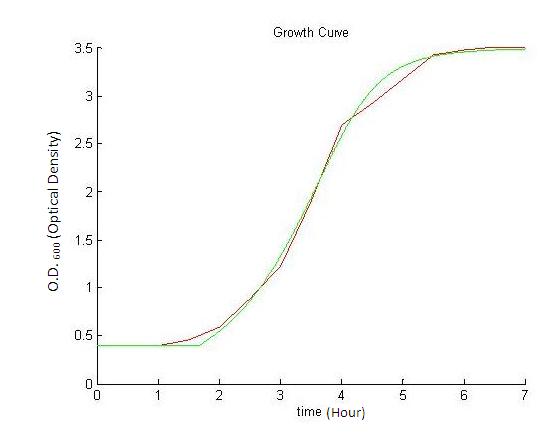
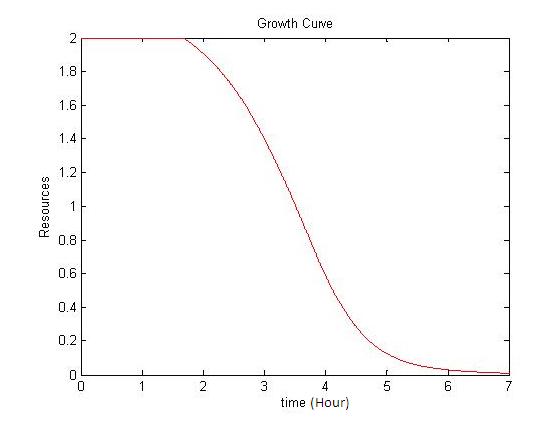
| - | The model for the growth curve was fitted to the experimental results | + | The model for the growth curve was fitted to the experimental.The results are shown below. The experimental results are depicted by the red curve, while our model is shown by the green curve. The resource curve was also plotted as a function of time and is shown below. |
| + | |||
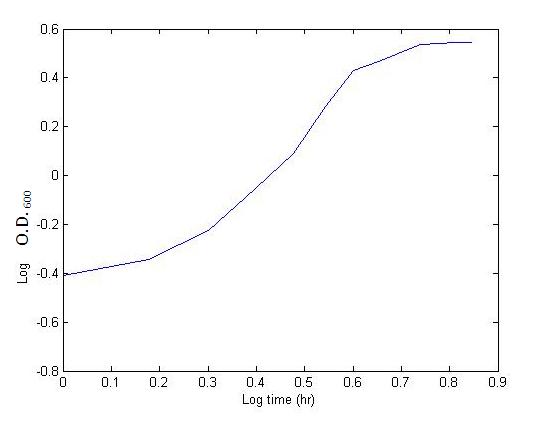
| + | Based on our experimental results from the Wet Lab, a log graph was plotted to determine the growth rate. The growth rate was then determined from the gradient of the log graph. This value was included when simulating the growth model using MATLAB. | ||
| + | |||
<html><table border="0" cellpadding="5" cellspacing="0" align="center"><tr><td width=33%></html>[[Image:Experimental_Result.JPG|thumb|center]]<html> | <html><table border="0" cellpadding="5" cellspacing="0" align="center"><tr><td width=33%></html>[[Image:Experimental_Result.JPG|thumb|center]]<html> | ||
</td><td></html>[[Image:Fitted_Curve.JPG|thumb|center]]<html> | </td><td></html>[[Image:Fitted_Curve.JPG|thumb|center]]<html> | ||
Revision as of 18:38, 29 October 2008
Modelling the Growth Curve
|
|||||||||||||||||||||
 "
"

