Team:Imperial College/Motility
From 2008.igem.org
| Line 51: | Line 51: | ||
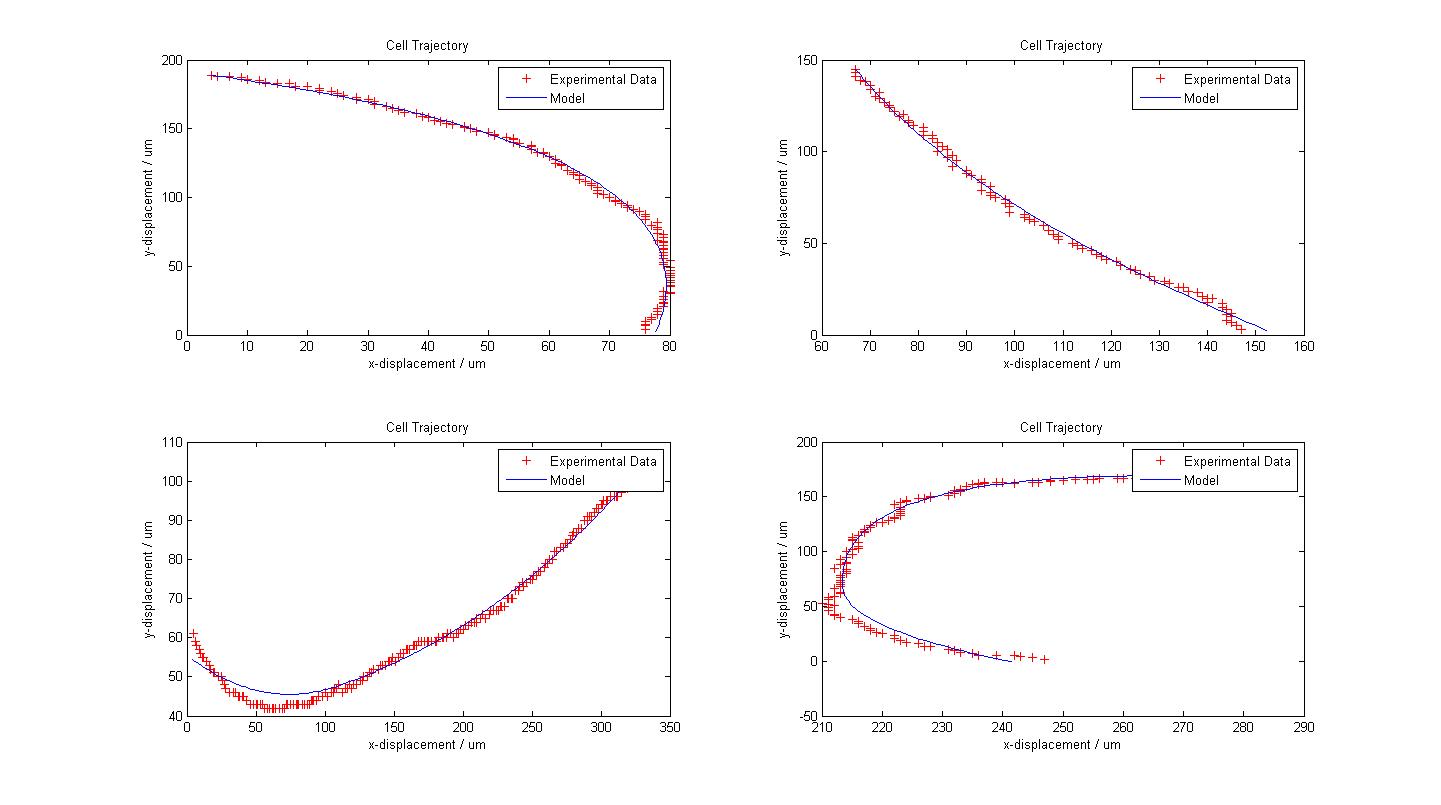
The following figure shows the results of our model fitting. We have introduced a change in flagellar force at certain points of the cell trajectory so as to achieve a better fit. A maximum of two runs were allowed for each cell trajectory. | The following figure shows the results of our model fitting. We have introduced a change in flagellar force at certain points of the cell trajectory so as to achieve a better fit. A maximum of two runs were allowed for each cell trajectory. | ||
| - | [[Image:Fitted_Models.jpg| | + | [[Image:Fitted_Models.jpg|800px|center]] |
| + | <center>Fitted Models with Experimental Data from 4 Cells</center><br> | ||
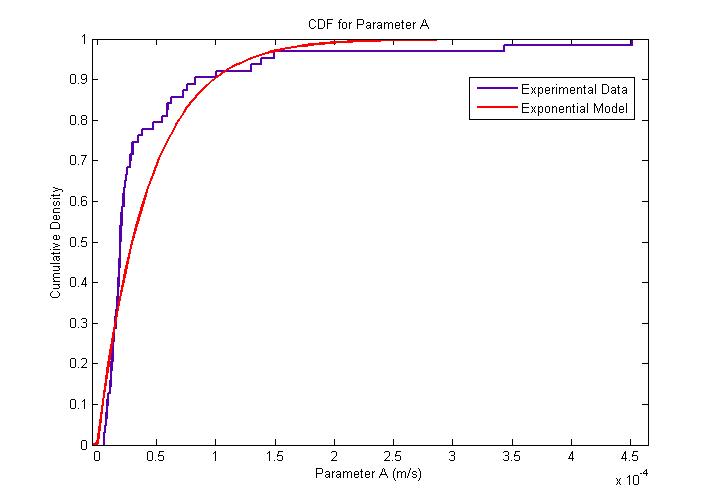
The MATLAB Distribution Fitting Tool was used to model the distribution of parameter A. Parameter A was found to be exponentially distributed. The following figures describe the probability density function and cumulative density function. | The MATLAB Distribution Fitting Tool was used to model the distribution of parameter A. Parameter A was found to be exponentially distributed. The following figures describe the probability density function and cumulative density function. | ||
| - | [[Image:Exponential_Distribution_for_Parameter_A_PDF.jpg|450px|center]]<br> | + | [[Image:Exponential_Distribution_for_Parameter_A_PDF.jpg|450px|center]] |
| - | [[Image:Exponential_Distribution_for_Parameter_A_CDF.jpg|450px|center]]<br> |}} | + | <center>Probability Distribution for Parameter A</center><br> |
| + | [[Image:Exponential_Distribution_for_Parameter_A_CDF.jpg|450px|center]] | ||
| + | <center>Cumulative Distribution for Parameter A</center><br> |}} | ||
{{Imperial/Box2|Conclusion| | {{Imperial/Box2|Conclusion| | ||
Revision as of 19:17, 29 October 2008
Motility Analysis
|
|||||||||||||||
 "
"

