Team:NTU-Singapore/Modelling/Parameter/r logistic
From 2008.igem.org
Revision as of 02:09, 25 October 2008 by Lalala8585 (Talk | contribs)
|
Parameter r analysis
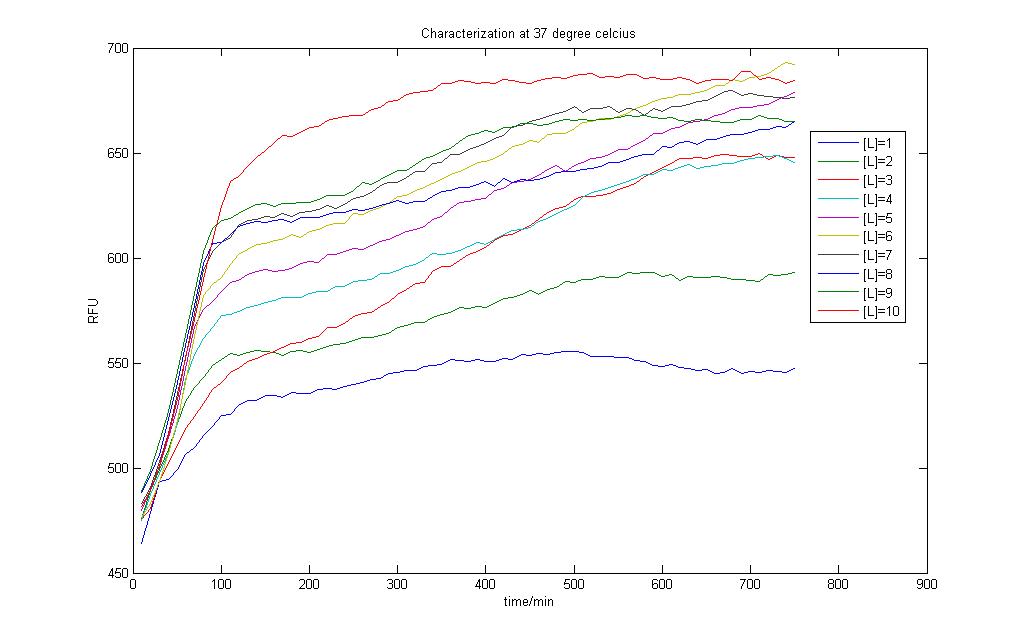
The above is the results from our characterisation experiment.
Here we attempt to change r over a range of values to observe how r affects the logistic growth output.
Graph of r
As seen the above run informs us that the growth rate at higher values cluster together and do not have much impact. We then investigate growth rates of lower values.
Graph of r
Here we choose r=0.01
 "
"


