Team:Newcastle University/Conclusions
From 2008.igem.org
Newcastle University
GOLD MEDAL WINNER 2008
| Home | Team | Original Aims | Software | Modelling | Proof of Concept Brick | Wet Lab | Conclusions |
|---|
Results
To analyse the results of the wet lab transformations of the inserts into B. subtilis, we used two methods: microscopy and flow cytometry.
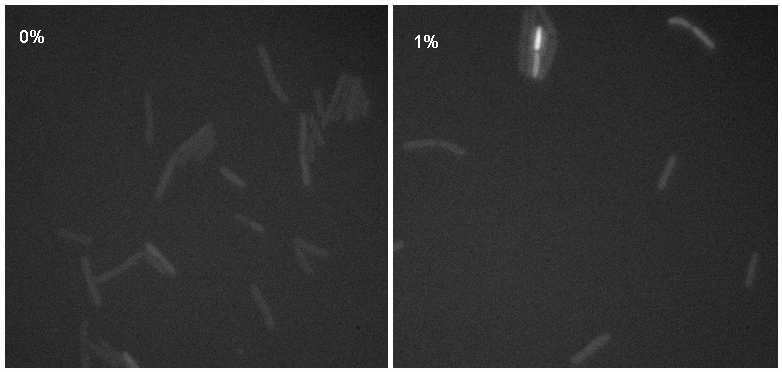
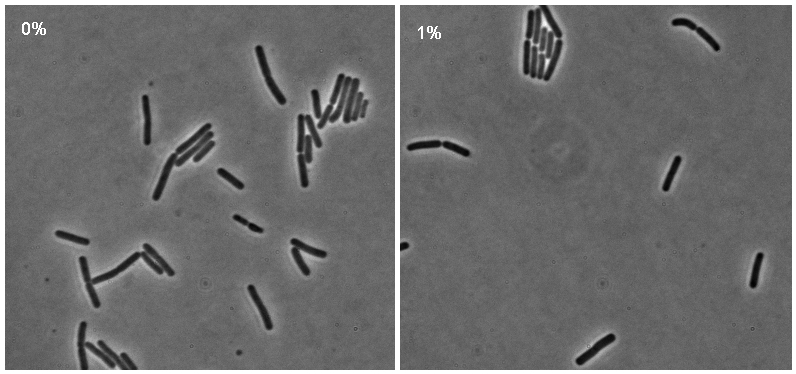
Microscopy work done on 08.09.08 showed a possible difference in the brightness of the iGEMgfp fluorescent cells (brighter in 10% subtilin-induced cells than in 0% subtilin-induced cells). However, there was little difference in the numbers of cells that fluoresced between the two cultures. There was no difference in either the number of fluorecent cells or their brightness between the 10% subtilin-induced and the 0% subtilin-induced iGEMcherry cells.
Flow cytometry
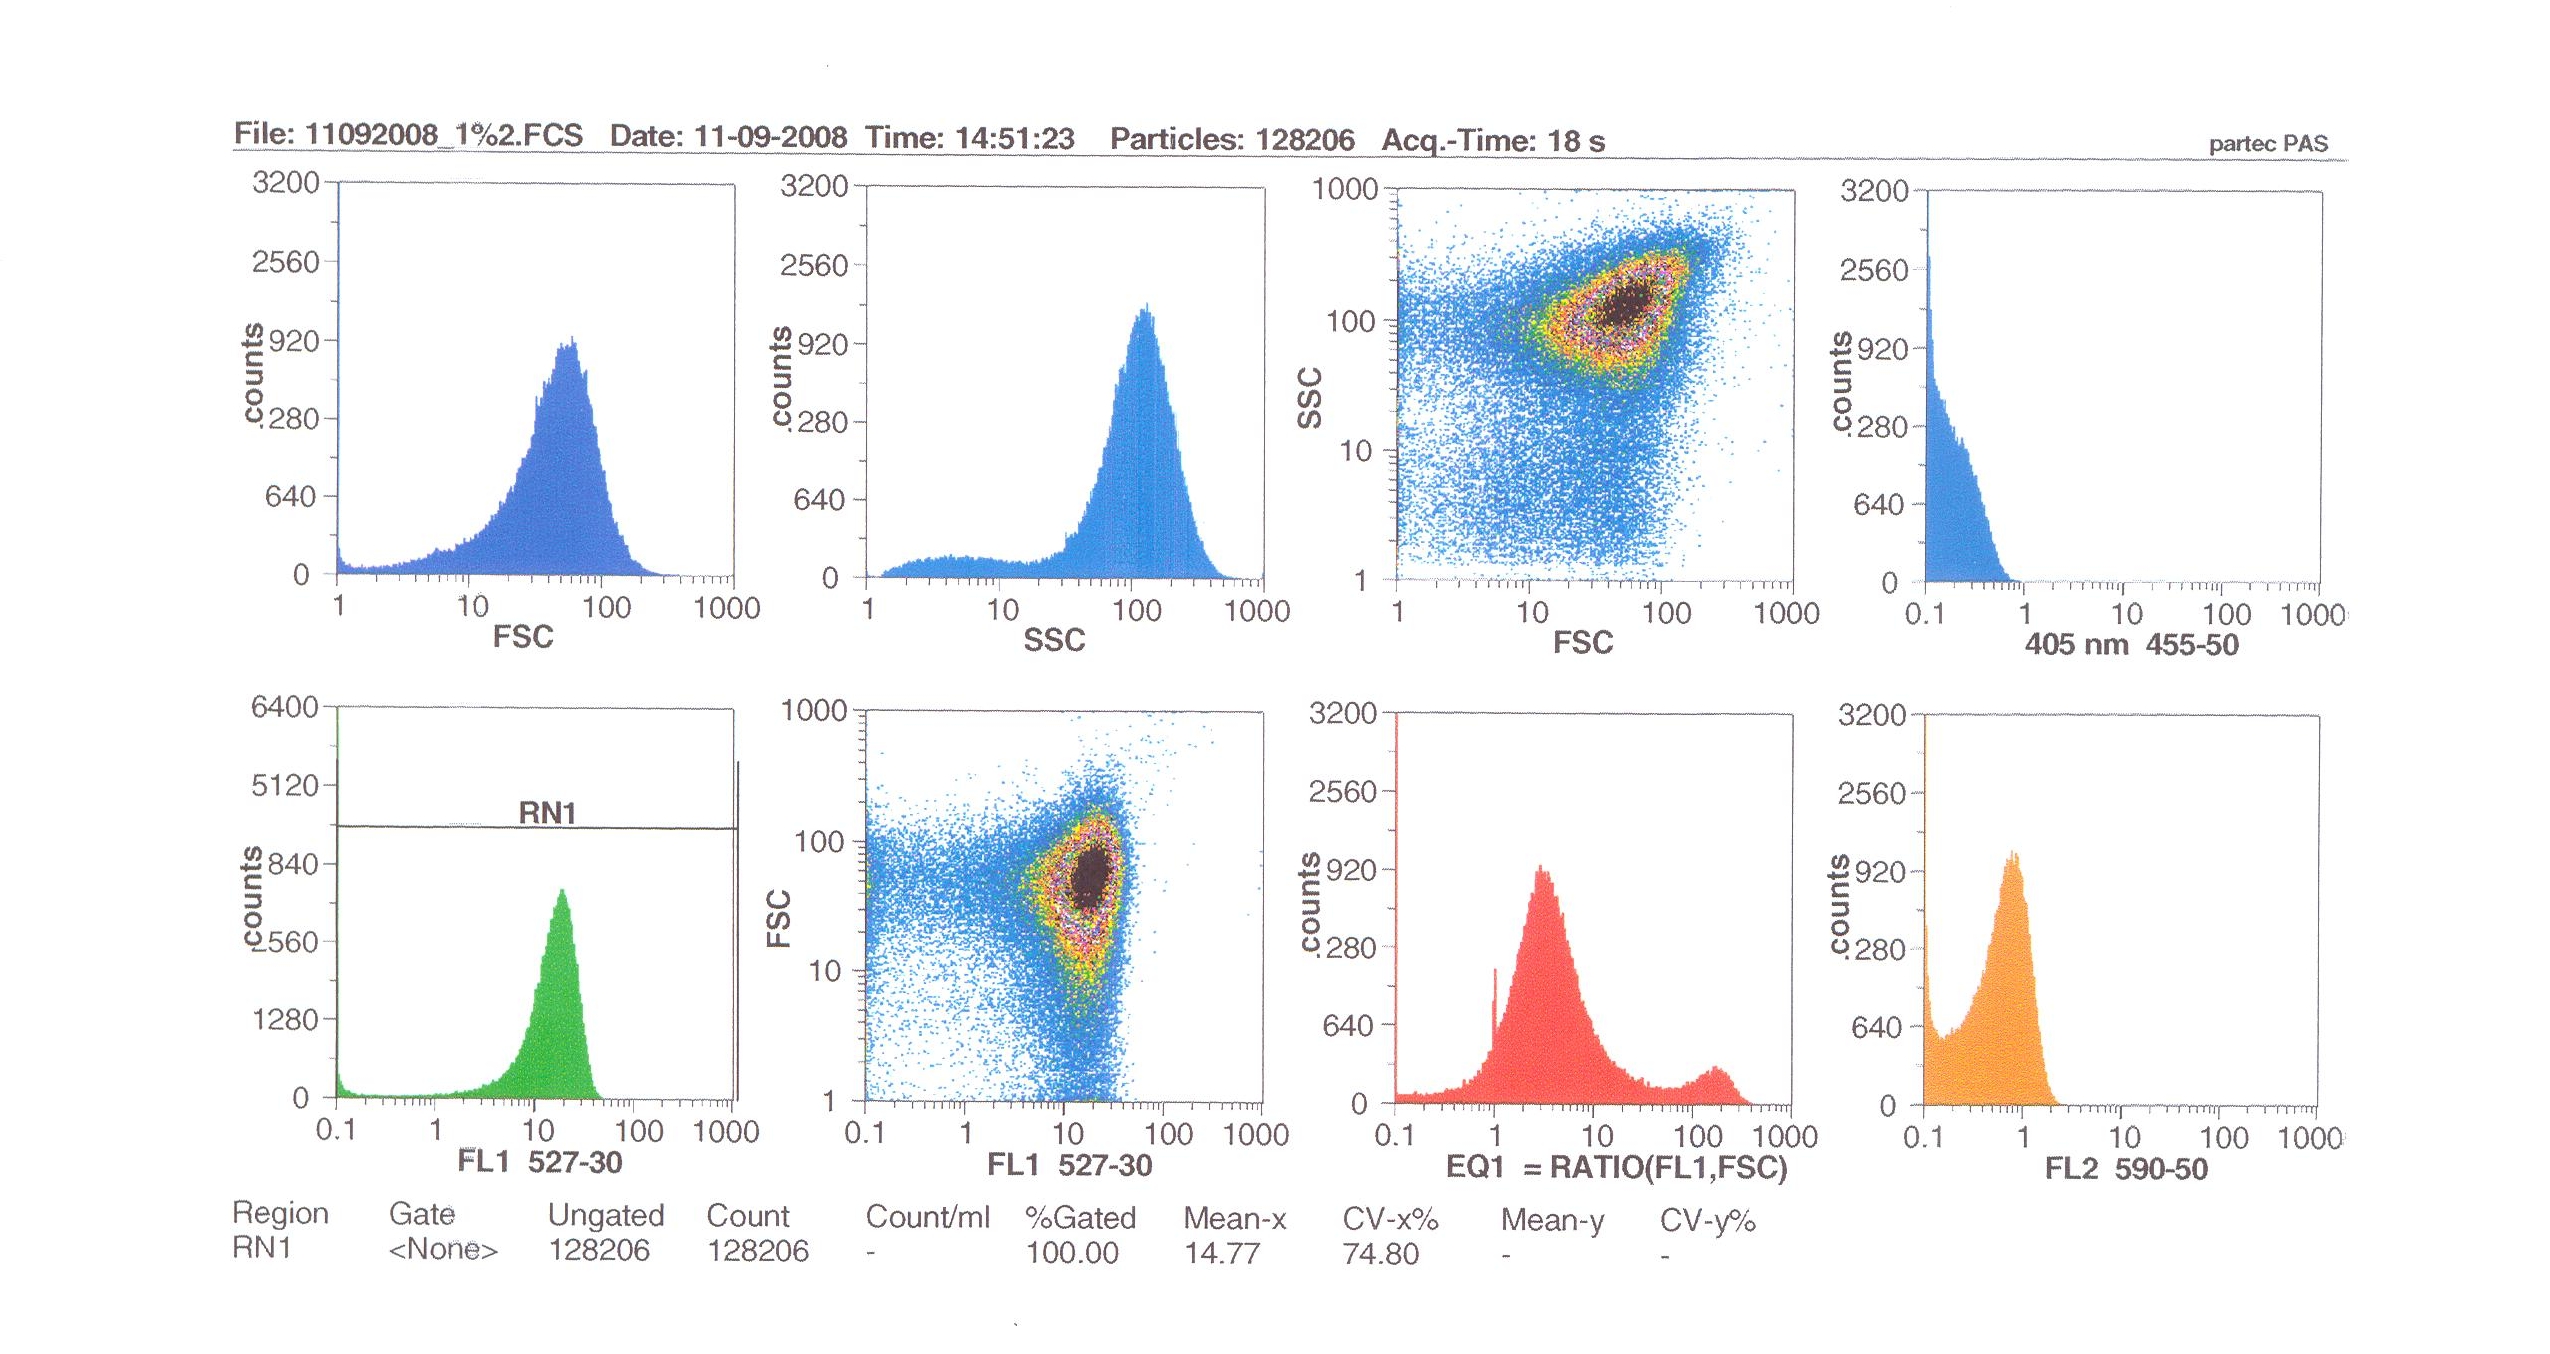
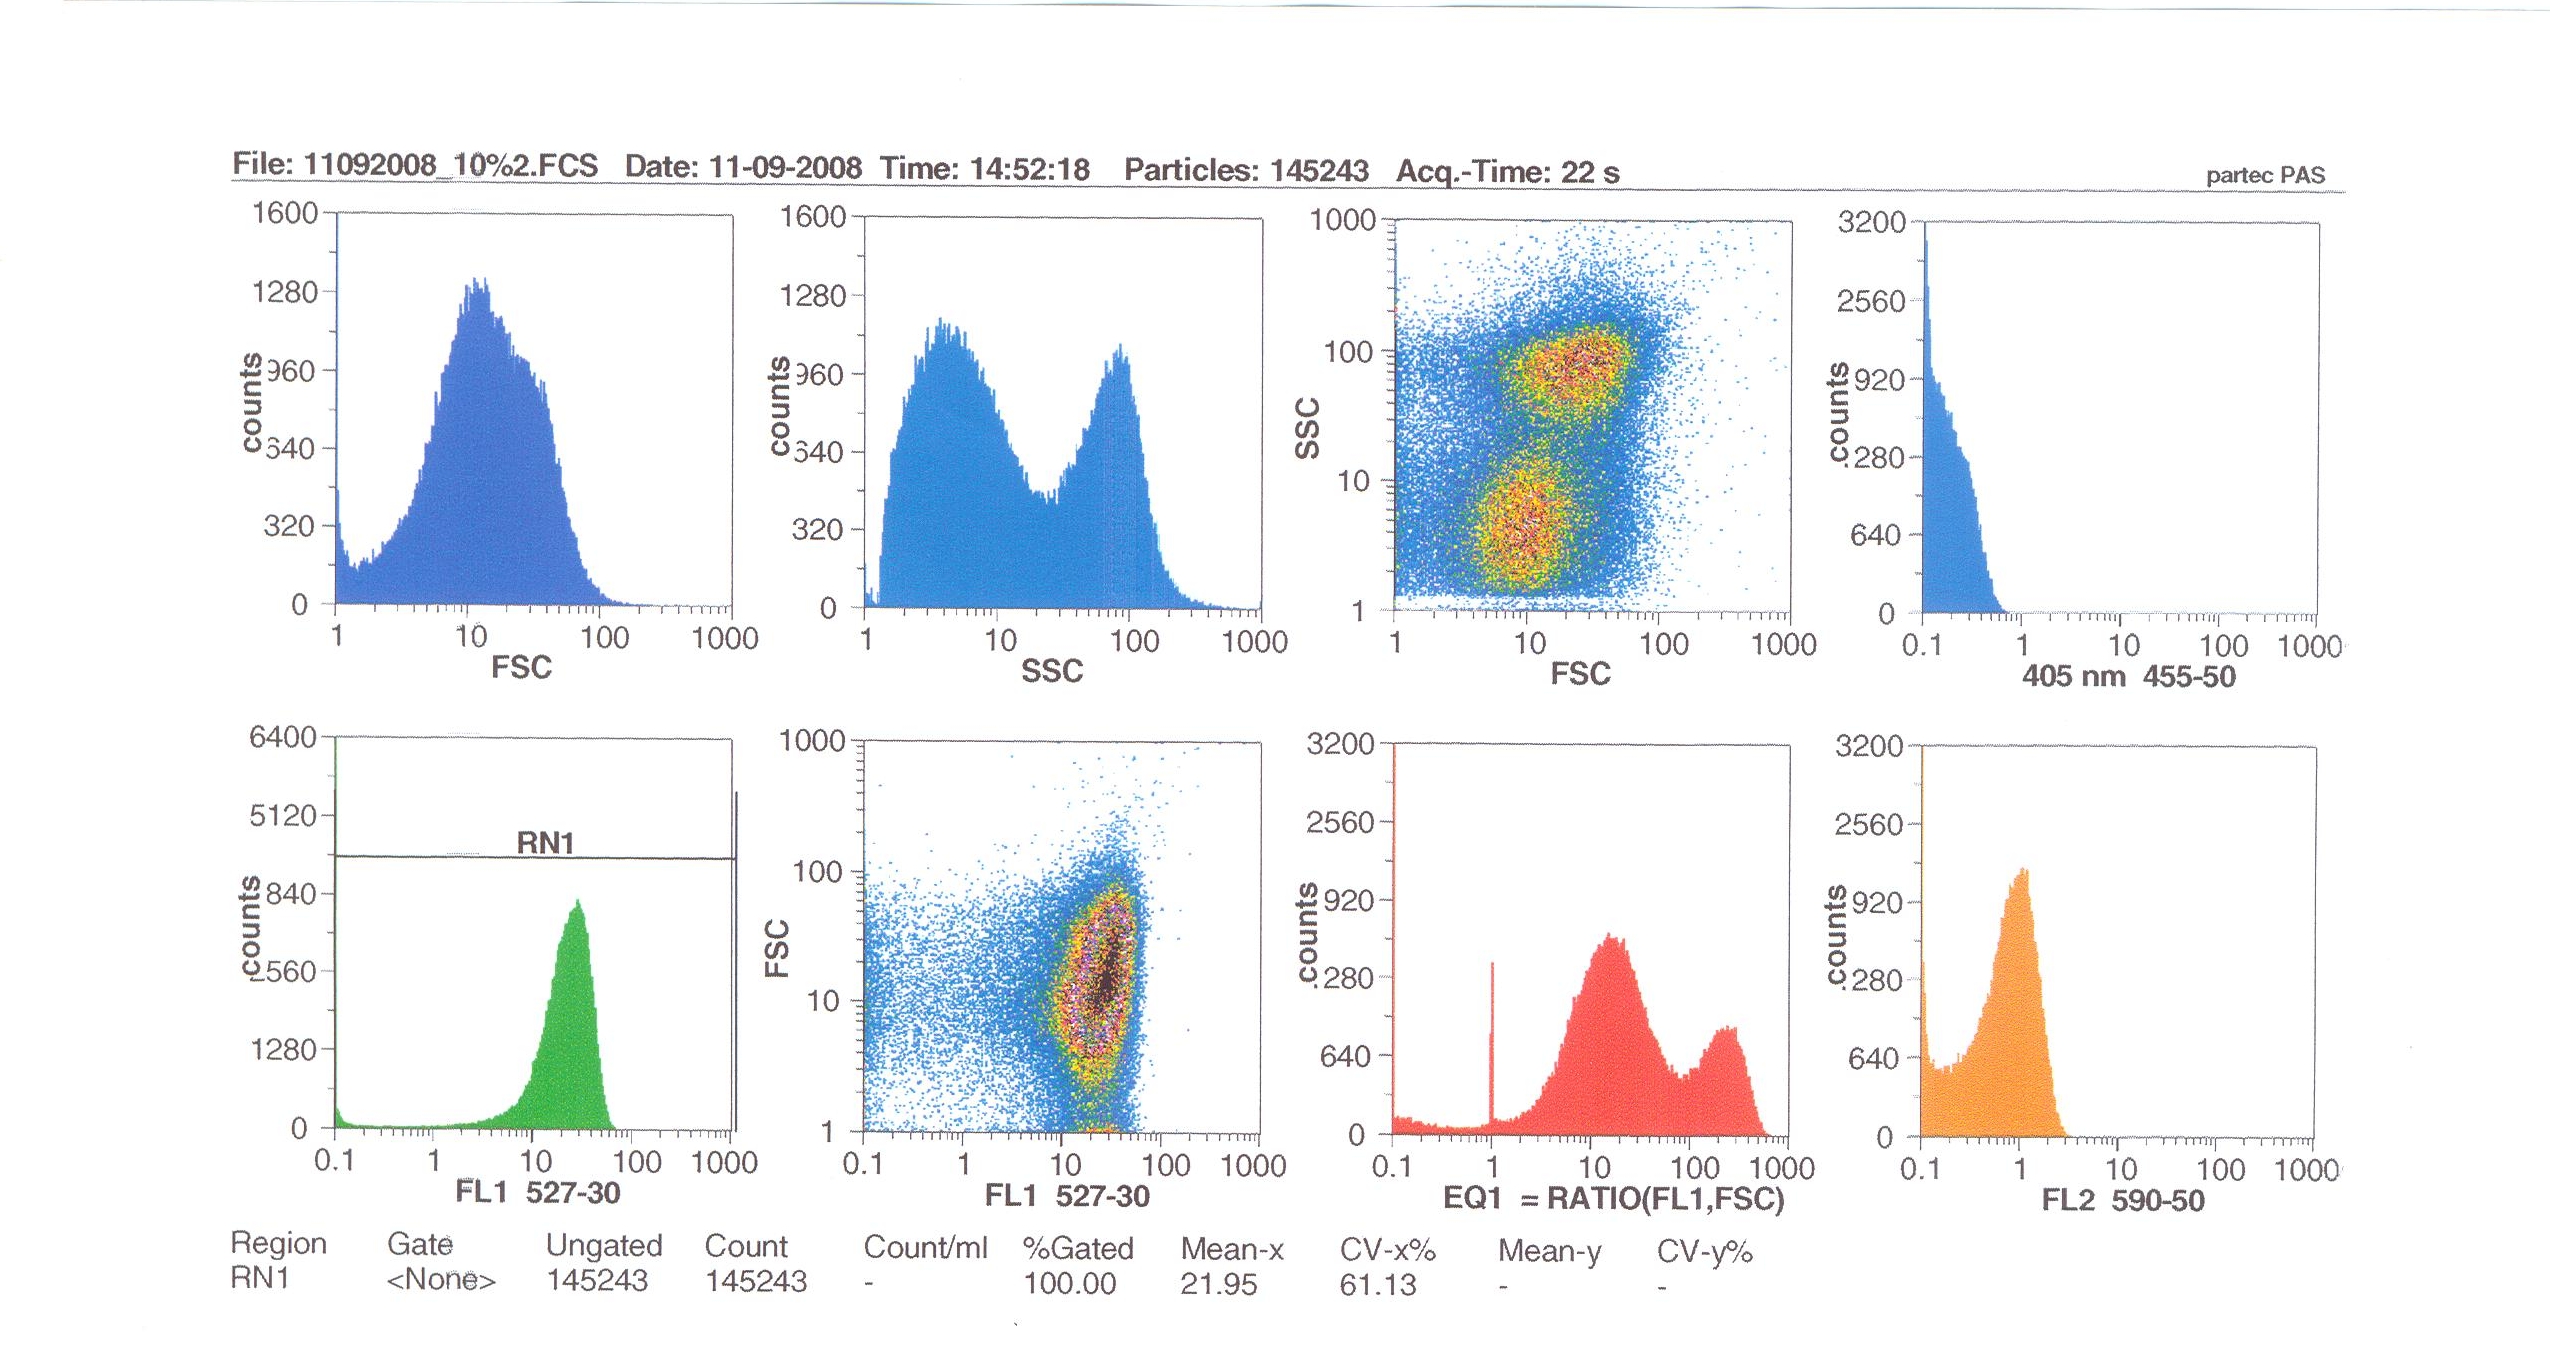
Flow cytometry allows us to quantify our results and present them in a graphical form. A sample of cells is injected into the machine and lasers are directed onto a hydro-dynamically focused stream of the fluid injected.
Each particle which passes thrugh the light beam will cause the laser to scatter in a particular way. Fluorescent chemicals may be excited into emitting light at a higher wavelength than the light source.
The detectors in the machine measure the scattering of light and any flourescence which occurs.
 "
"


