Team:NTU-Singapore/Modelling/Constructs
From 2008.igem.org
|
Contents |
Constructs of the system
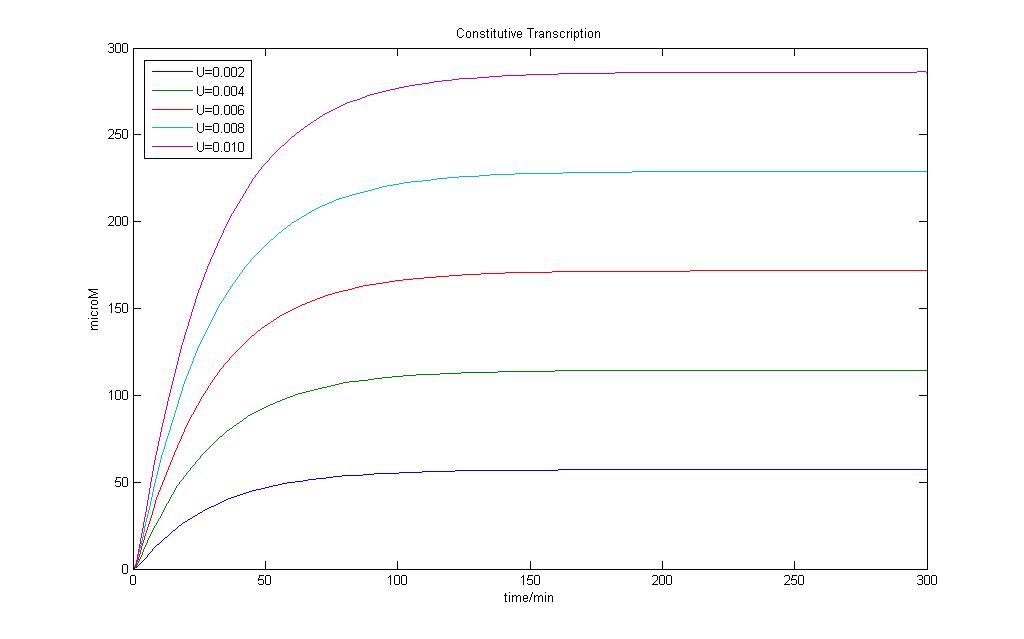
Constitutive Protein Synthesis
The constitutive model allows us to understand how fast steady state can be achieved for basal transcription. We observe that by time = 150 min, the constitutive protein transcription hits a steady state and this timing would help us later on to decide when we should introduce any form of input to the system. Any further change observed would be due to this input variable rather than the basal transcription.
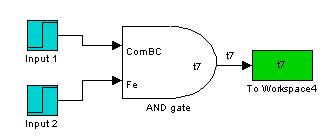
AND Gate
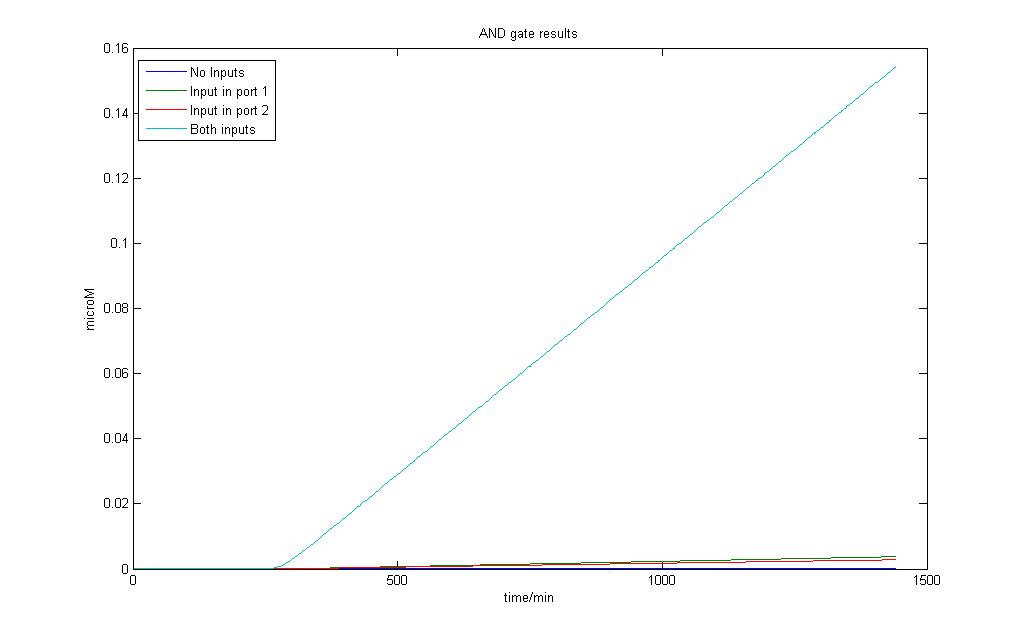
Addition of inputs was done at 250 minutes.
The AND gate model allows us to observe that even when there is no input, basal transcription still yields a certain amount of product. The difference is observed both inputs are applied and a sharp increase over the basal amount can be easily observed. The AND gate works as expected and it would be used in our modeling exercise.
We can observe AND gate behaviour in this sense as it is impossible to have no protein production at all even in the most well-regulated system.
Complex Formation
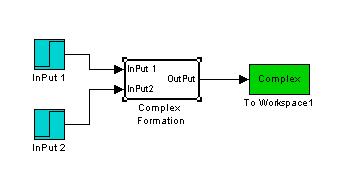
This is the Simulink Model Construct for Complex Formations. The model is tested by applying an input when time = 150 min.
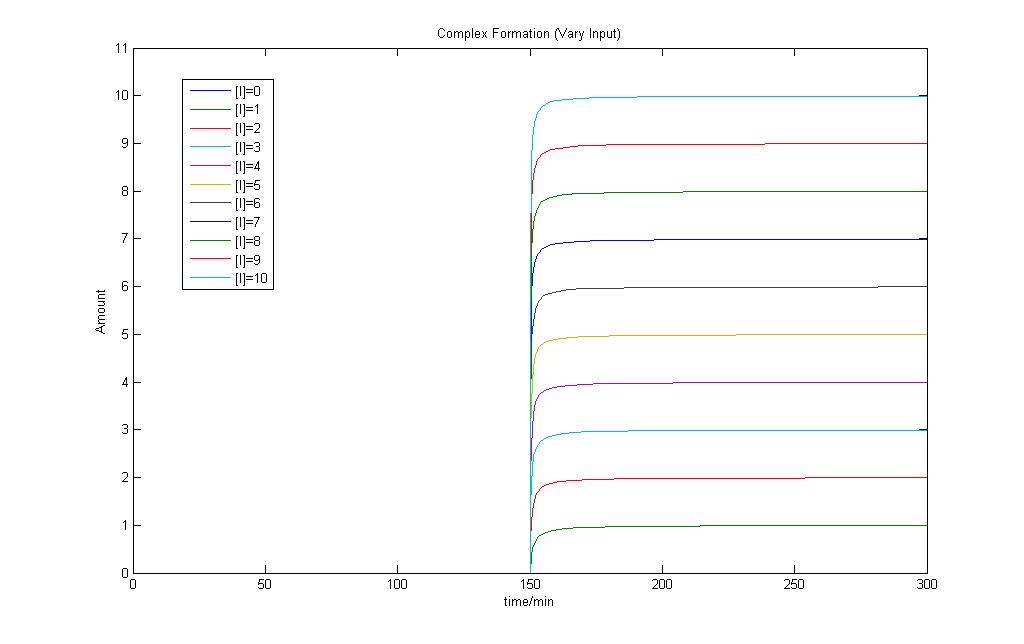
By increasing the input, we can see an increase in the amount of complex formed. The complex equation works well as it works as expected. We can see from the figure that as both inputs are increased, there is a significant difference between the complex formed.
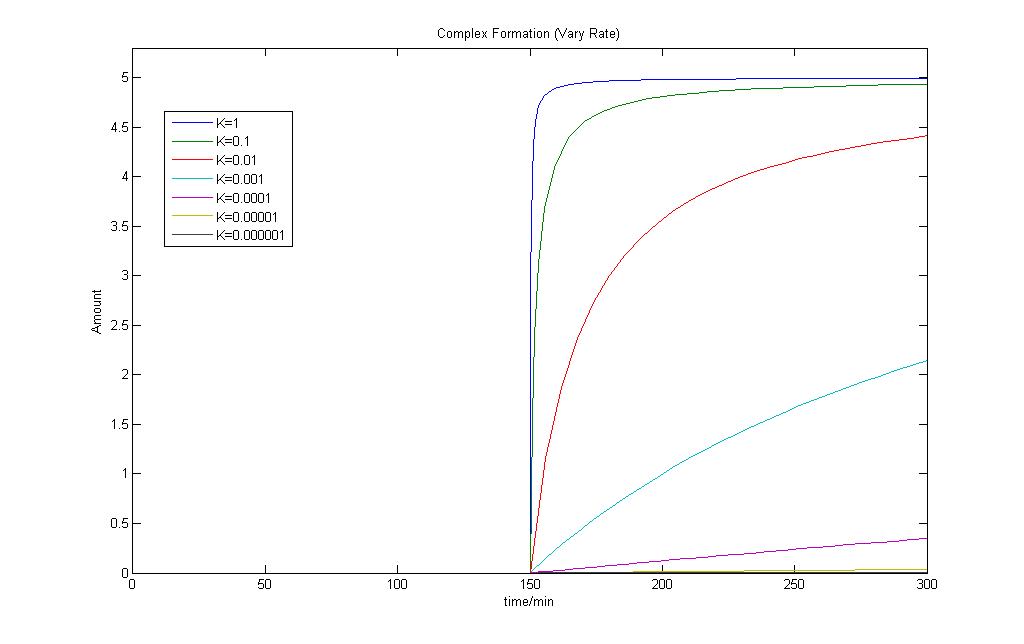
By changing the rate of Complex formation, we can also see a change in the amount of complex formed. The above figures show the result of varying the rate of complex formation and it reminds us that the rate of complex formation should not be too small when we use this equation later on in our modeling execises. When the rate drops to 0.0001, practically no complex is formed fast enough to see a significant difference over time.
Both results show that the model works fine and can be used in our modeling exercises later on.
Regulated Transcription
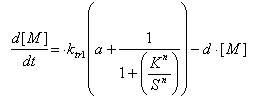
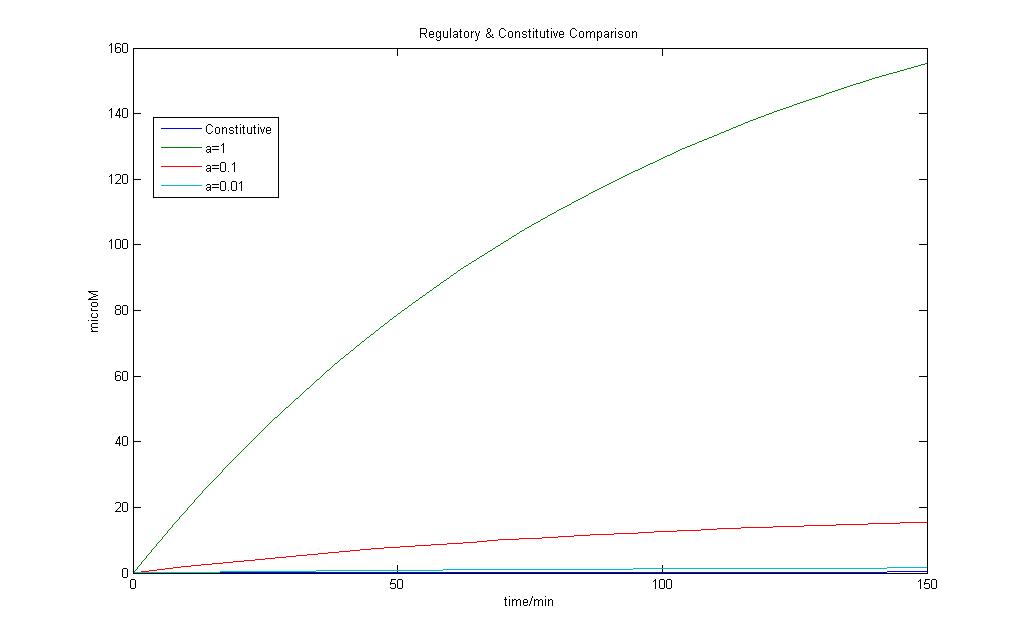
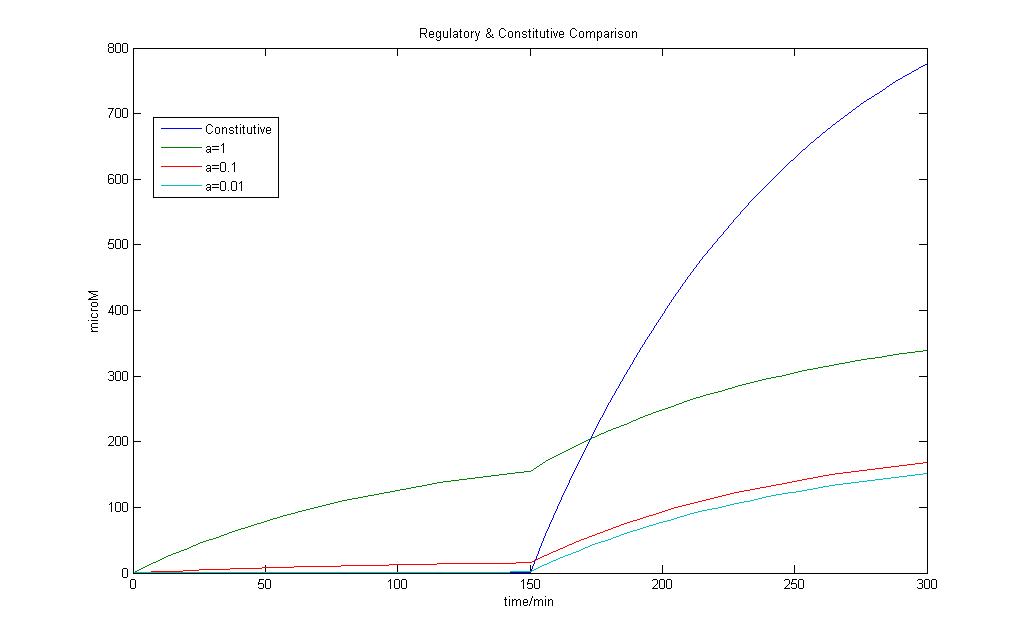
The model for regulated transcription is compared with the model used in Constitutive transcription. Input into both models was done when time = 150 min. This would allow us to see if there is a difference under two different conditions for the two models.
The results of the modeling exercise shows that if the parameter a > 0.01, it would introduce a basal rate transcription that is higher than that of constitutive transcription.
However upon the introduction of a stronger signal, constitutive transcription is still faster than that of regulated transcription.
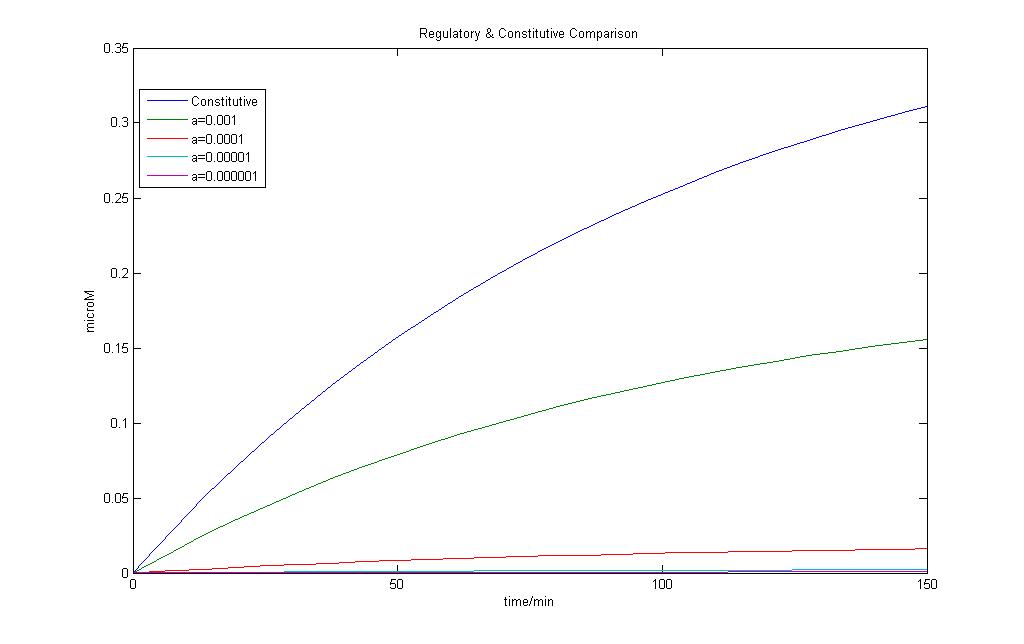
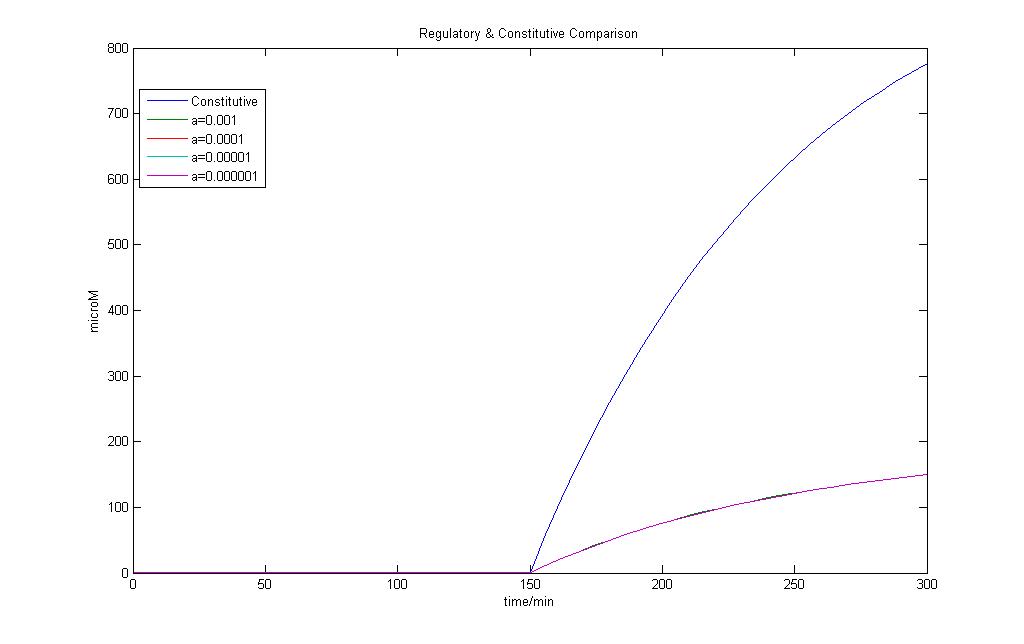
If parameter a < 0.01, we can see that constitutive transcription is faster than that of regulated transcription. The formation of mRNA is slower and more strongly regulated.
When we allow the model to run for longer time periods, we can see that for Regulated transcription, the output is almost the same, and that the limiting value is around a =0.001. It is to be noted that the model is subjected to very simple input signals as this point of time and in the actual modeling exercise, the upstream activities may affect the results observed later on. This simple exercise just allows us to have a feel of the kind of models we are putting in place and a basis to guess the parameters later on.
 "
"


