Team:NTU-Singapore/Parts/Standard Promoters
From 2008.igem.org
|
Contents |
Standard Promoters
In the first edition of the [http://partsregistry.org/Measurement/SPU/Measure iGEM newsletter], it elaborated a method that was similar to the approach that our team had adopted for our own characterization procedure. We have decided to make use of the protocol given to us, however with some minor modifications.
Transformation of parts
The parts transformed are:
- pLacI-GFP [http://partsregistry.org/wiki/index.php?title=Part:BBa_J04430 BBa_J04430],
- Standard promoter with GFP reporter [http://partsregistry.org/Part:BBa_I20260 BBa_I20260]
- GFP reporter devices with Weak promoter[http://partsregistry.org/Part:BBa_J23150 BBa_J23150],
- Medium promoter [http://partsregistry.org/Part:BBa_J23151 BBa_J23151] and
- Strong promoter [http://partsregistry.org/Part:BBa_J23102 BBa_J23102]
Discussion
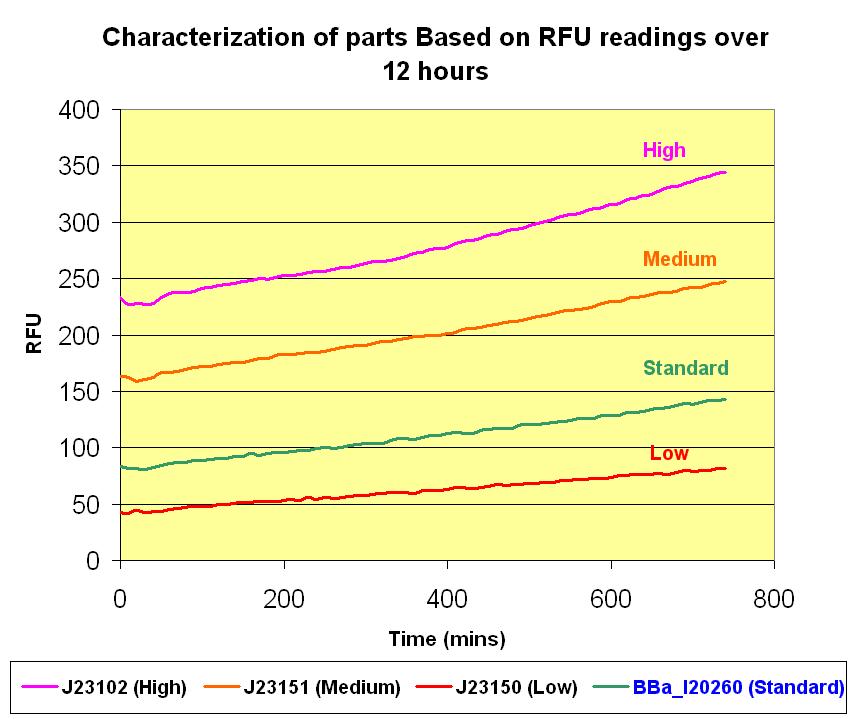
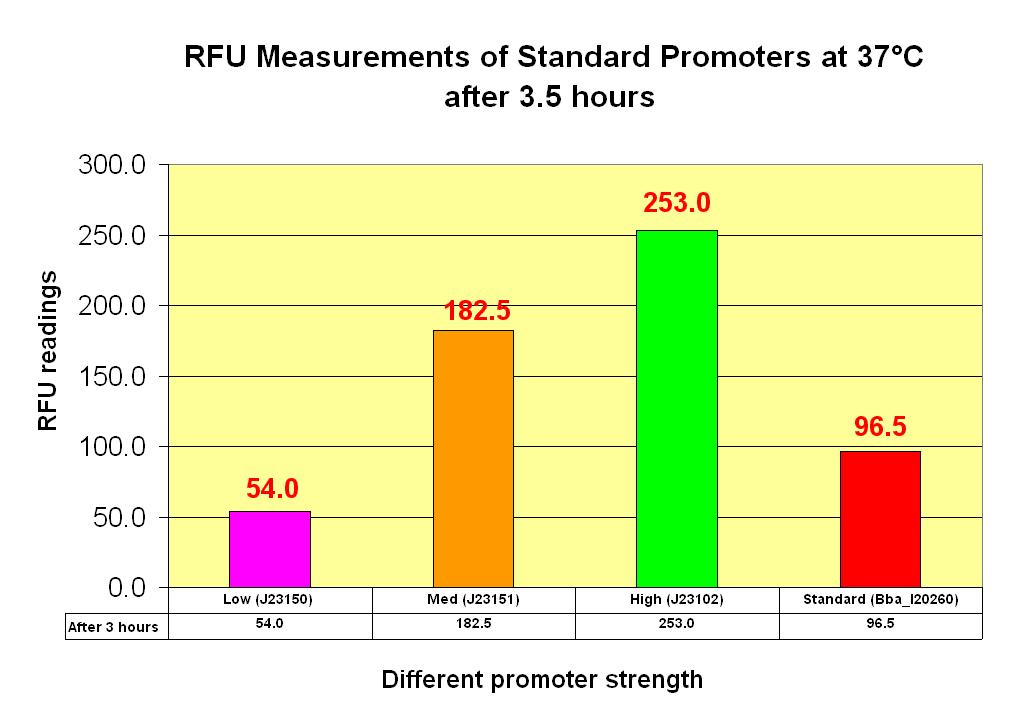
With the parts transformed, we can proceed with the characterization based on the protocol we constructed. We make use of the FLx800™ Fluorescence Microplate Reader to take the readings of the fluorescence that is emitted by the GFP reporting devices by measuring the relative fluorescence units (RFU). The different strength of the promoters associated with the same GFP reporting device, E0240 will determine the rate of transcription of the GFP protein. The stronger the promoter, the higher is the rate of its transcription. This results in more GFP proteins formed which in turns relates to more fluorescence being emitted. This direct proportionality brings us closer to quantifying the strength of any promoter of interest. Hence a standard promoter was used to compare the RFU with other promoters. Based on the newsletter, there are also the Low, Medium and High promoters.
Results
Firstly, the parts in listed above were transformed into the Top 10 competent cells. After which, for a time duration of 12 hours, readings were taken at 10 minutes intervals. The graphs below illustrate the results we obtained and the detailed data points and graphs plotting can be retrieved from the File:NTU@iGEM Results for characterization pLacI 010708.xls.
 "
"


