Team:NTU-Singapore/Parts/Parameter Estimation using Characterization Results
From 2008.igem.org
|
Contents |
Lactose Induced GFP production
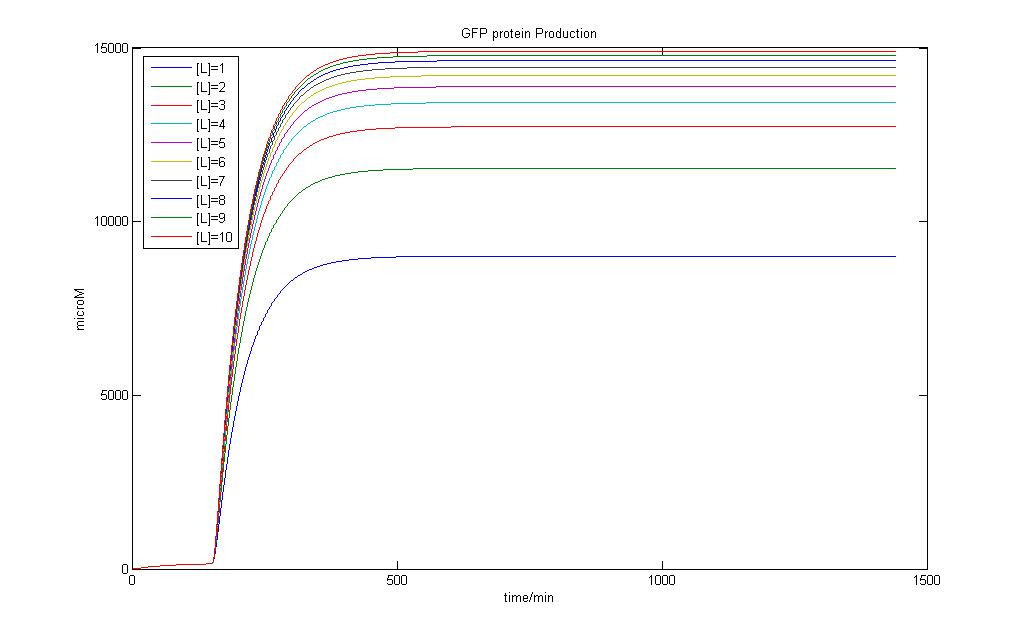
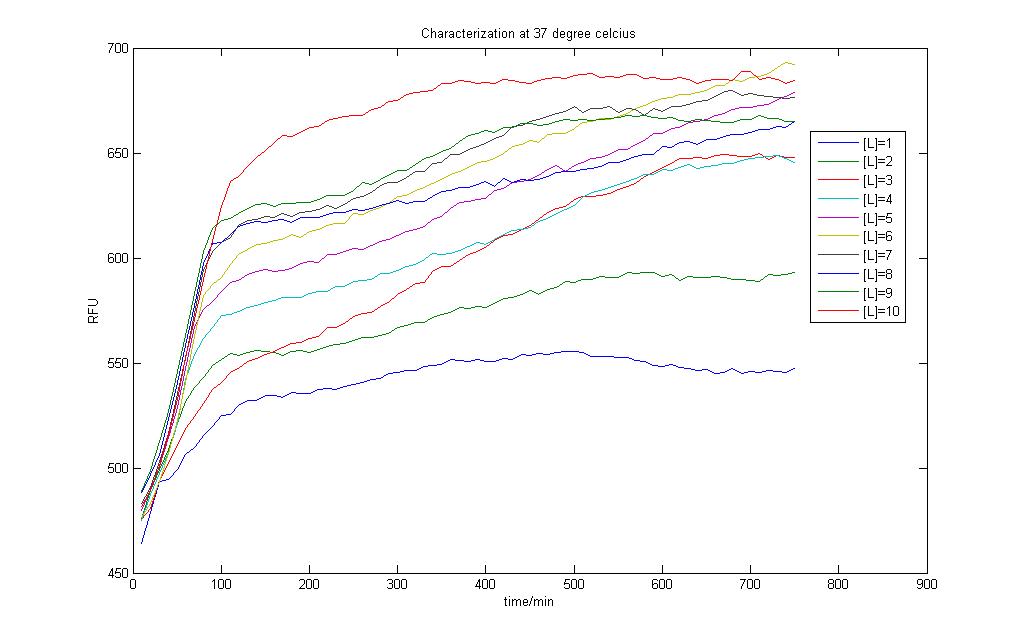
In the above two figures, we have a comparison between the model generated by our very own equations versus the RFU results that we have obtained using our characterization procedures. There are certain features that are our outstanding when these two figures are compared.
1)The deterministic model has not captured any of the stochastic features the real situation presented before us. 2)The model seems to hit steady state much faster than the actual situation
Careful observation of the results from the characterisation and one would notice that the output takes on the form of a sigmoid curve. Indeed, one of the major flaws in our modeling exercise was that the models don't account for cell growth. Even though we used M9 medium to do our characterisation, it is impossible to assume the cells don't multiply and grow within the 12 hour time period!
This prompts us to look into a better model such that we can first capture the essentials of the real situation before we decide to use our models with our characterisation results
Creating a Logistic Growth Construct
The logistic growth model is typically applied to growth kinetics of Microbes and other natural phenomena. This phenomena is based on the fact that no population can expand exponentially forever and there will be a certain limit to the number of species based on the space that is available.
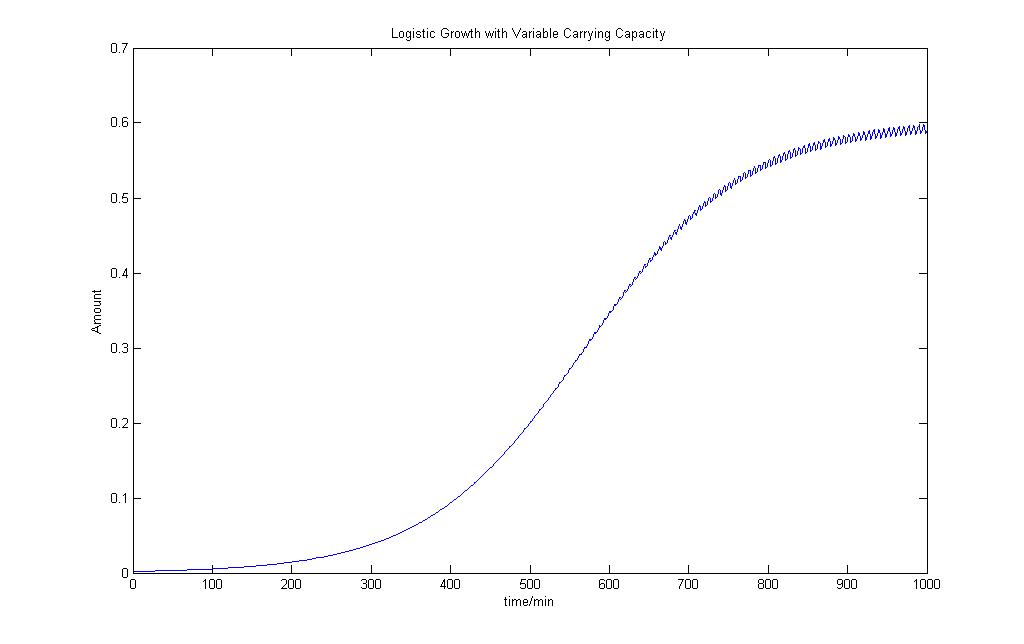
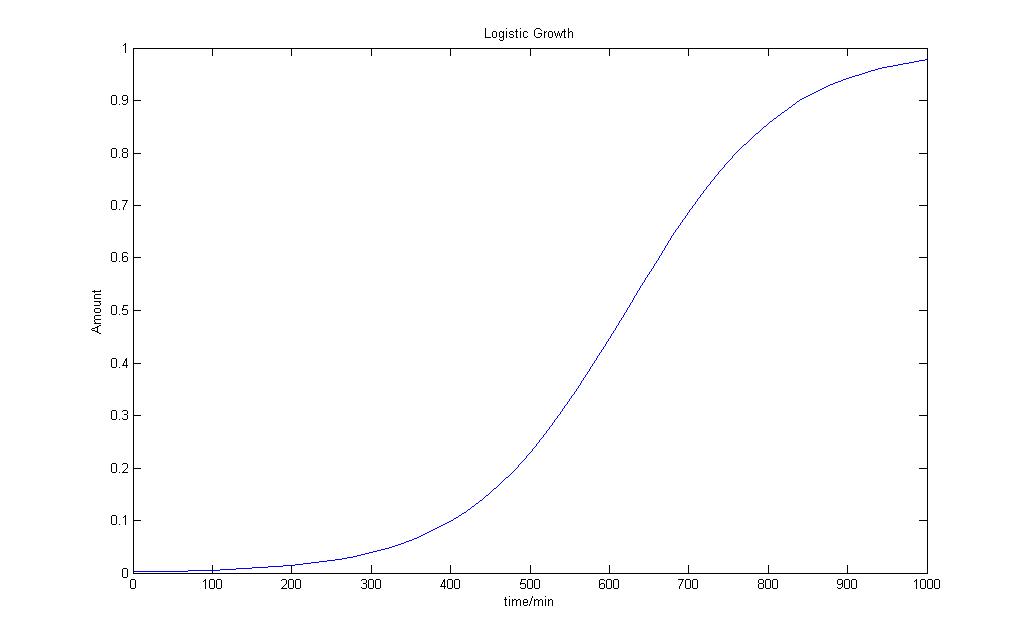
Here we explore the results of three Logistic Growth equations and their various outputs to see how well the results turn out to be.
Logistic Growth Model

N = number of species in the population
t = time
Nmax = Maximum number of species in the ecosystem
r = intrinsic rate of natural increase
Logistic Growth Model with lag phase

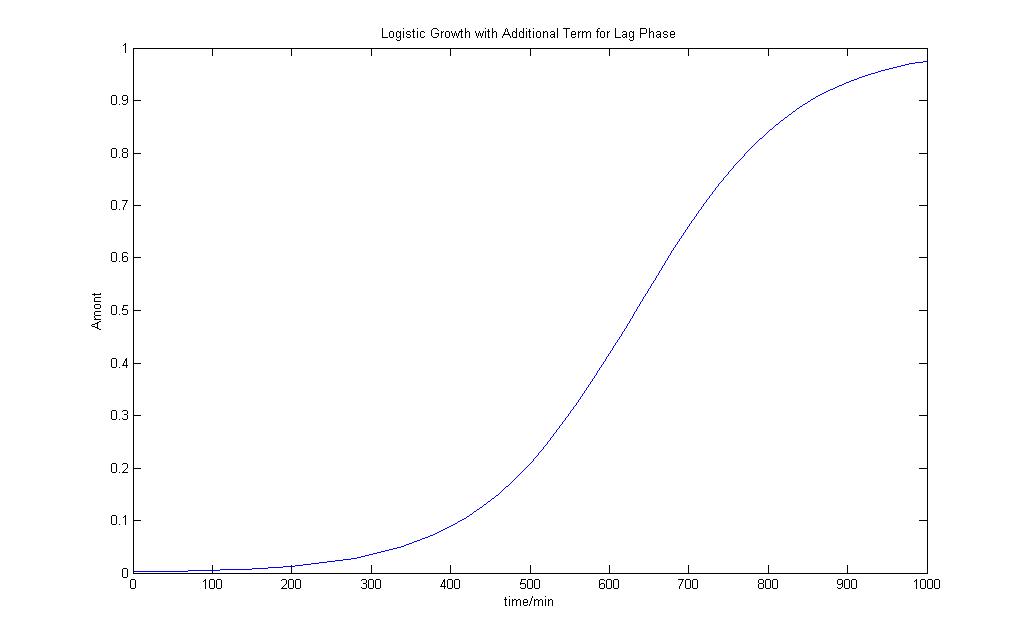
Nmin = Minimum number of species in the ecosystem
c = Adjustment factor
Logistic Growth Model with Varying Carrying Capacity
Revisiting the general idea of our modeling, we have treated each bacteria cell to work as a CSTR (Continuous stirred Reactor).
However, each bacteria is itself a reactor and these "mini reactors" multiply and grow~!
References
1. A new logistic model for Escherichia coli growth at constant and dynamic temperatures FUJIKAWA Hiroshi ; KAI Akemi ; MOROZUMI Satoshi
 "
"

