Team:ETH Zurich/Modeling/Switch Circuit
From 2008.igem.org
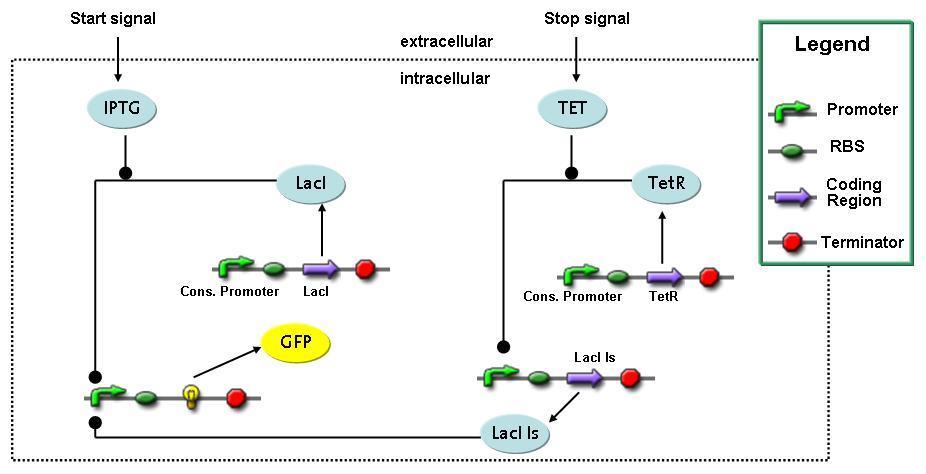
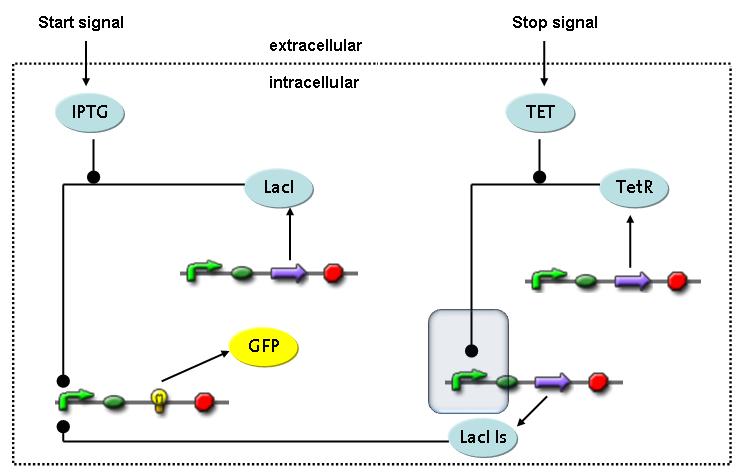
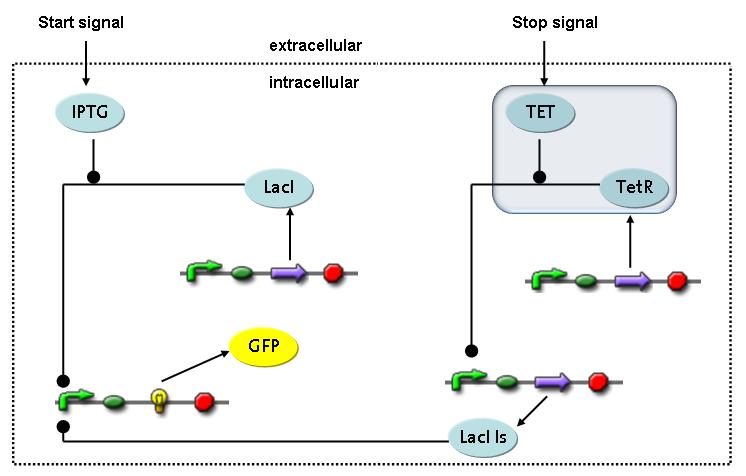
Switch CircuitWe designed a novel switching circuit consisting of two inputs and one output – a start signal initiates the synthesis of a specific protein, and a terminating signalswitches gene expression off. The goal of this system is the controlled expression of a restriction enzyme to delete genome fragments in vivo.
In order to do some preliminary experiments, the restriction enzyme has been substitued by a fluorescent protein. The basic idea of the how the system should work is as follows :
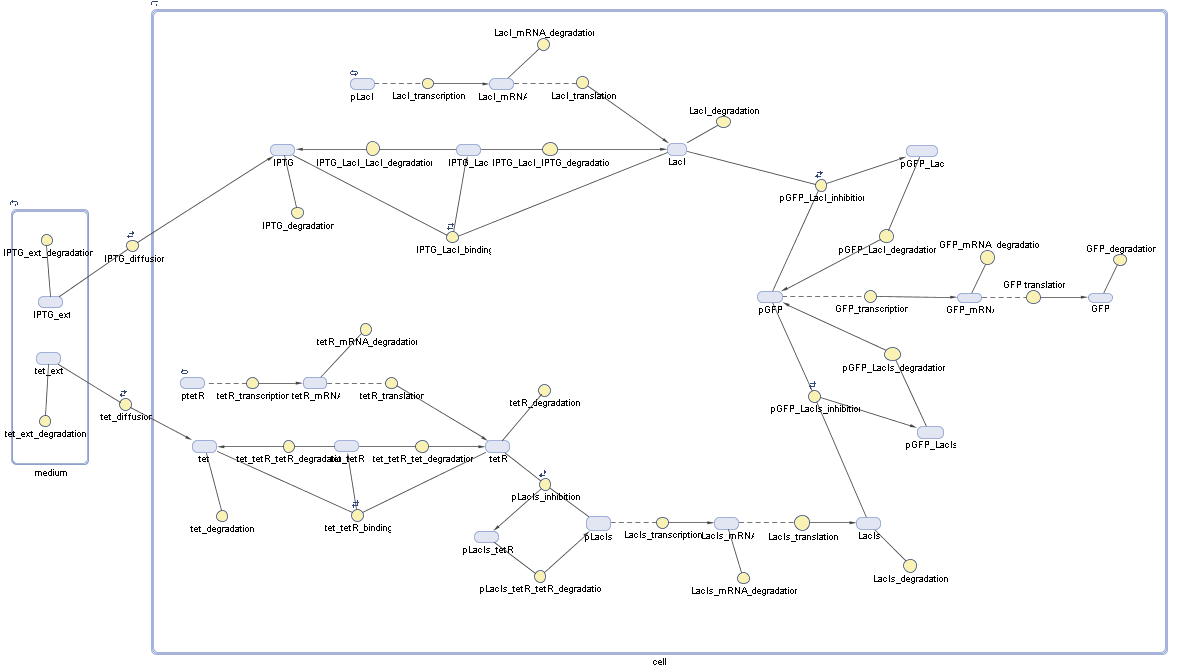
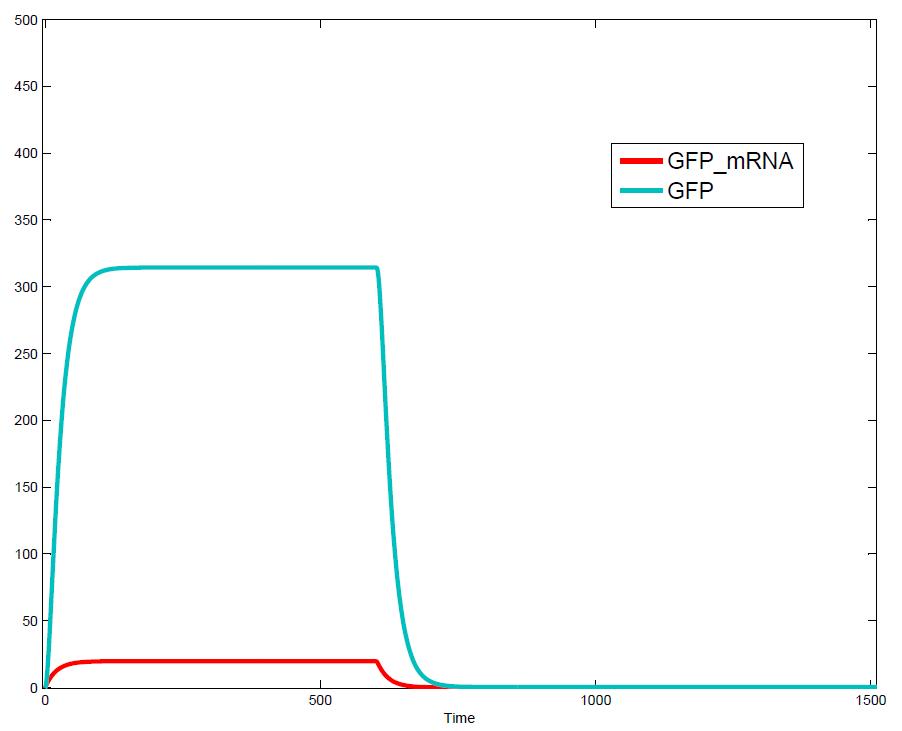
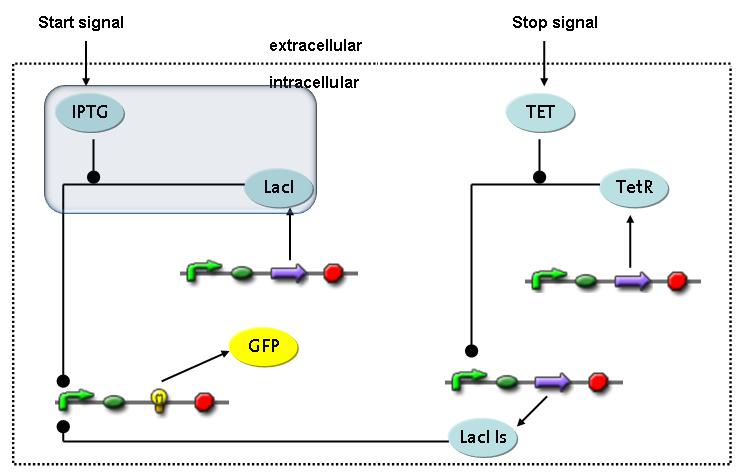
Fluorescent protein gene expression is under the control of LacI and can be induced by the addition of IPTG. In order to stop gene expression, the IPTG-sensitive LacI is replaced by IPTG-insensitive LacIS, which shuts restriction enzyme gene expression off again. The synthesis of LacIS is started by the addition of Tetracyclin to the system, which binds to the tet repressor TetR and thus de-represses the expression of the lacIs gene. The fluorescent protein is tagged, so that it is degraded faster by the Clp protease and vanishes faster from the system as its expression has been stopped. This switching circuit is described by a set of 64 chemical reactions and XX molecular species. (see "Detailed Model") In order to do a computational analysis of the circuit, this model has been simplified and implemented in MATLAB. Then the system has been simulated using ODE and stochastic solvers. Implementation and SimulationImplementationFor the implementation, different steps having no significant effects on the aspired results have been neglected for the sake of simplicity. In the transcriptions the additional step involving the RNA-Polymerase and in the translations the step involving the ribosomes have not been taken into account. Furthermore, the effects of the dimerization of TetR as well as the impacts of dimerization and tetramerization of LacI and LacIIs have not been considered in the final implementation. This simplified model still comprises more than 20 different species and over 30 kinetic reactions and has been implemented by using the Simbiology Toolbox in MATLAB. To get any useful results form the model, we performed deterministic and stochastic simulations based on the Mass-Action-Kinetics. The stochastic simulations turned out to be computationally very exhaustive but generated no further significant information compared to the deterministic simulations. Simulation Results
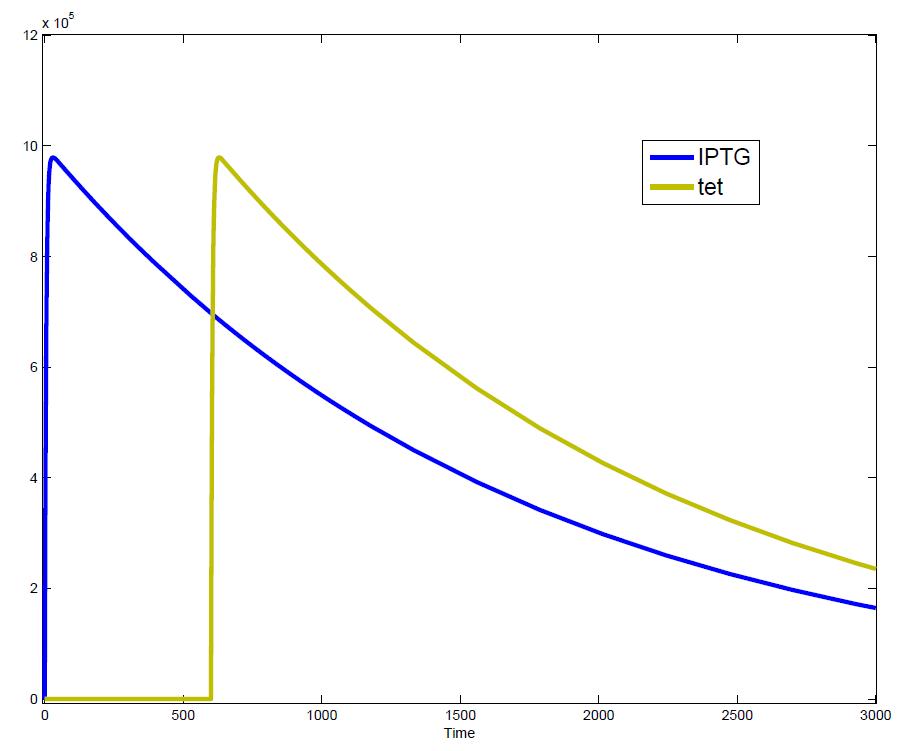
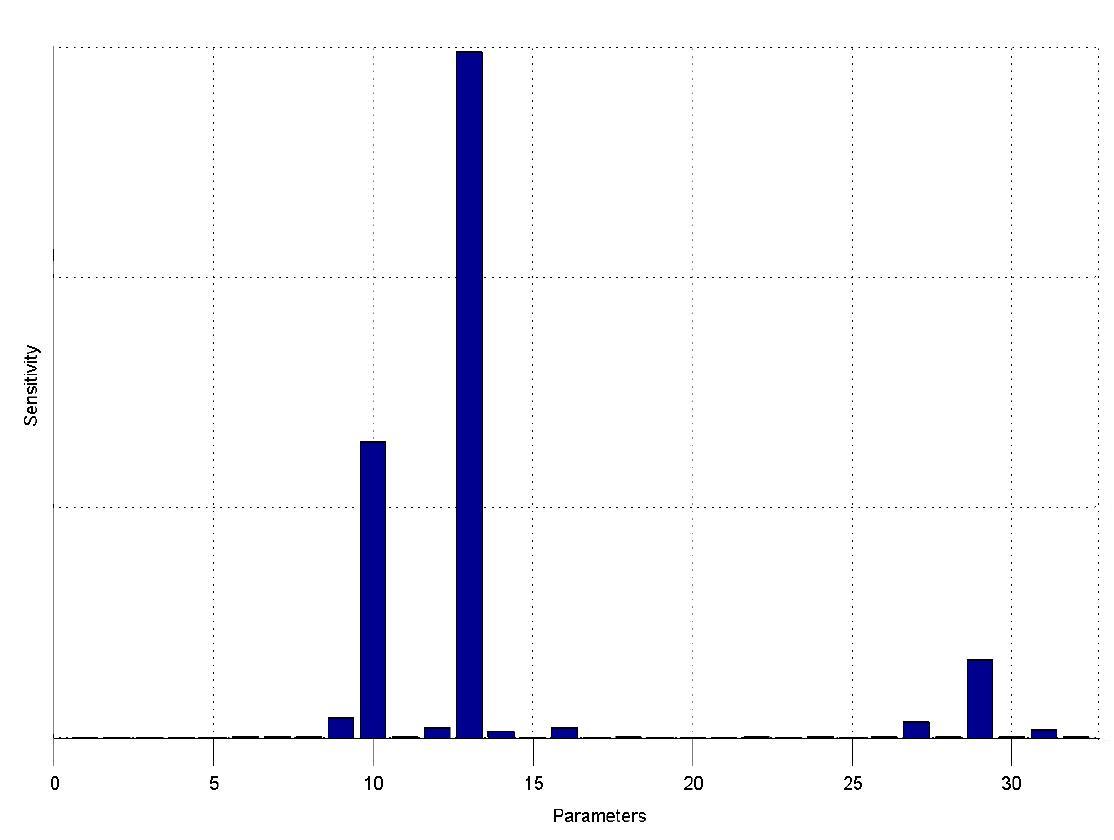
Another fact, our simulations show, is that in order to get one single pulse, the tet-concentration inside the medium must not reach zero before all the IPTG has degraded too. Otherwise, there would still be IPTG in the system inhibiting the binding of LacI to the FP-promotor and leading to an unwanted expression of our protein of interest as the LacIIs degrades. Sensitivity AnalysisWe define the sensitivity as the change of the production of the desired fluorescence protein - which is the output of our system - depending on the change of the paramters.
The sensitivity analysis shows, that the concentration of the fluorescent protein strongly depends on its decay rate (paramter 13) the decay rate of its mRNA (paramter 10) and of course the transcription and translation rates of the protein (paramters 29 and 27), which is no surprise.
We can also see that the decay rate of LacIIs (paramter 9) and the transcription rate of LacIIs (paramter 31) have an influence on the expression of the fluorescent protein.
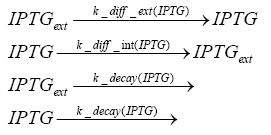
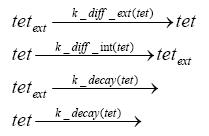
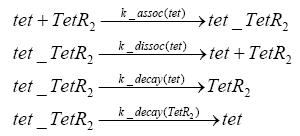
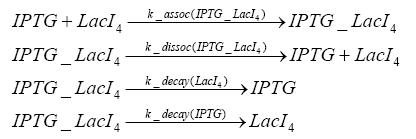
Detailed Modeldiffusion of IPTGIn order to switch on the circuit, we induce with IPTG. When IPTG is added into the medium it diffuses reversibly between the medium and the cells, where it is slowly degraded. In a chemostat extracellular IPTG is washed away. diffusion of tetThe second inducer which is used in our system is tet. This one also diffuses into the cell when it is added into the medium and degrades slowly. binding of TetR to LacIIs-promotorTetR is constitutively expressed and binds to the LacIIs promotor, inhibiting its expression. binding of LacI and LacIIs to GFP-promotorLacI which is constitutively expressed and LacIIs which is under the control of a tet repressor both can bind to the GFP promotor. binding of tet to TetRpromotor. binding of IPTG to LacIpromotor. transcription and translation of LacI
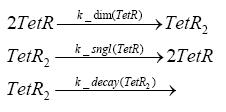
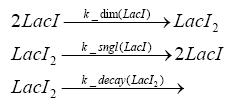
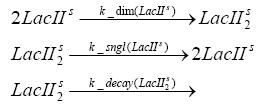
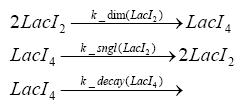
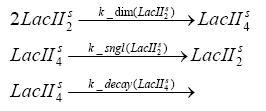
transcription and translation of LacIIstranscription and translation of TetRtranscription and translation of GFPdimerization of tetRdimerization and tetramerization of LacI and LacIIs
ParametersIn this section you can find all the parameters used in the simulation.
References(1) "Spatiotemporal control of gene expression with pulse-generating networks", Basu et al., PNAS, 2004 (2) "Genetic circuit building blocks for cellular computation, communications, and signal processing", Weiss et al., Natural Computing, 2003 (3) "Predicting stochastic gene expression dynamics in single cells", Mettetal et al., PNAS, 2006 (4) "Engineered gene circuits", Hasty et al., Nature, 2002 |
 "
"
