Team:ETH Zurich/Wetlab/Chemostat Selection
From 2008.igem.org
|
Chemostat selectionGoalThe goal of our project is to find the minimal genome that is able to sustain a living E. coli in a specific environmental condition. In the previous section, we have introduced the method we want to apply for reducing the genome. However, manually selecting for those bacteria that have successfully reduced their genomes is obviously impossible. Therefore, we have to find a mechanism that automatically selects cells possessing a reduced genome. IdeaOur idea is to set up a continuous bacterial culture in which cells with a reduced genome overgrow those maintaining more chromosomal DNA. However, bacteria with a smaller genome do not automatically grow faster than those containing more DNA. This is due to the fact that the rate of proliferation is influenced not only by the replication velocity, but also by other factors such as protein synthesis, etc. Therefore, we have to introduce a constraint that renders DNA synthesis the limiting factor of the growth rate. In this scenario, reducing chromosomal DNA would speed up replication leading to fastest growth of those cells with the smallest genome. This way, we would not have to look for bacteria with reduced genomes, but we could let them do it for us! MethodChemostatA chemostat is the instrument of choice for setting up a continuous culture. It is characterized by a continuous influx of medium, and an efflux of bacterial culture of the same volume. Since the volume of the continuous culture is kept constant, the growth rate of the population can be set by the dilution rate. Under these conditions, slowly growing (growth rate < dilution rate) cells will be washed out of the culture, while the fastest growing clone will take the lead and finally dominate the entire culture. A model of the selection mechanism can be found in Chemostat Selection, where we estimate the initial parameters for optimal selection.
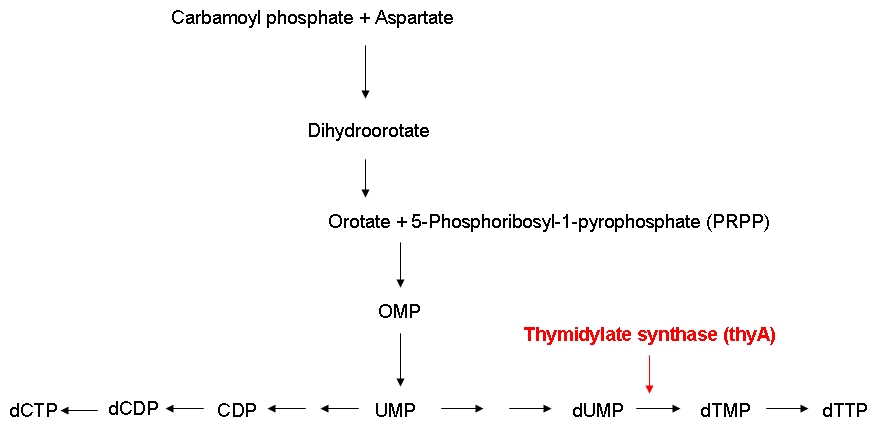
Growth constraintAs mentioned above, we want to introduce a constraint that renders DNA synthesis the limiting factor of the growth rate. DNA synthesis in bacterial cells is accomplished using the following biosynthetic pathway:
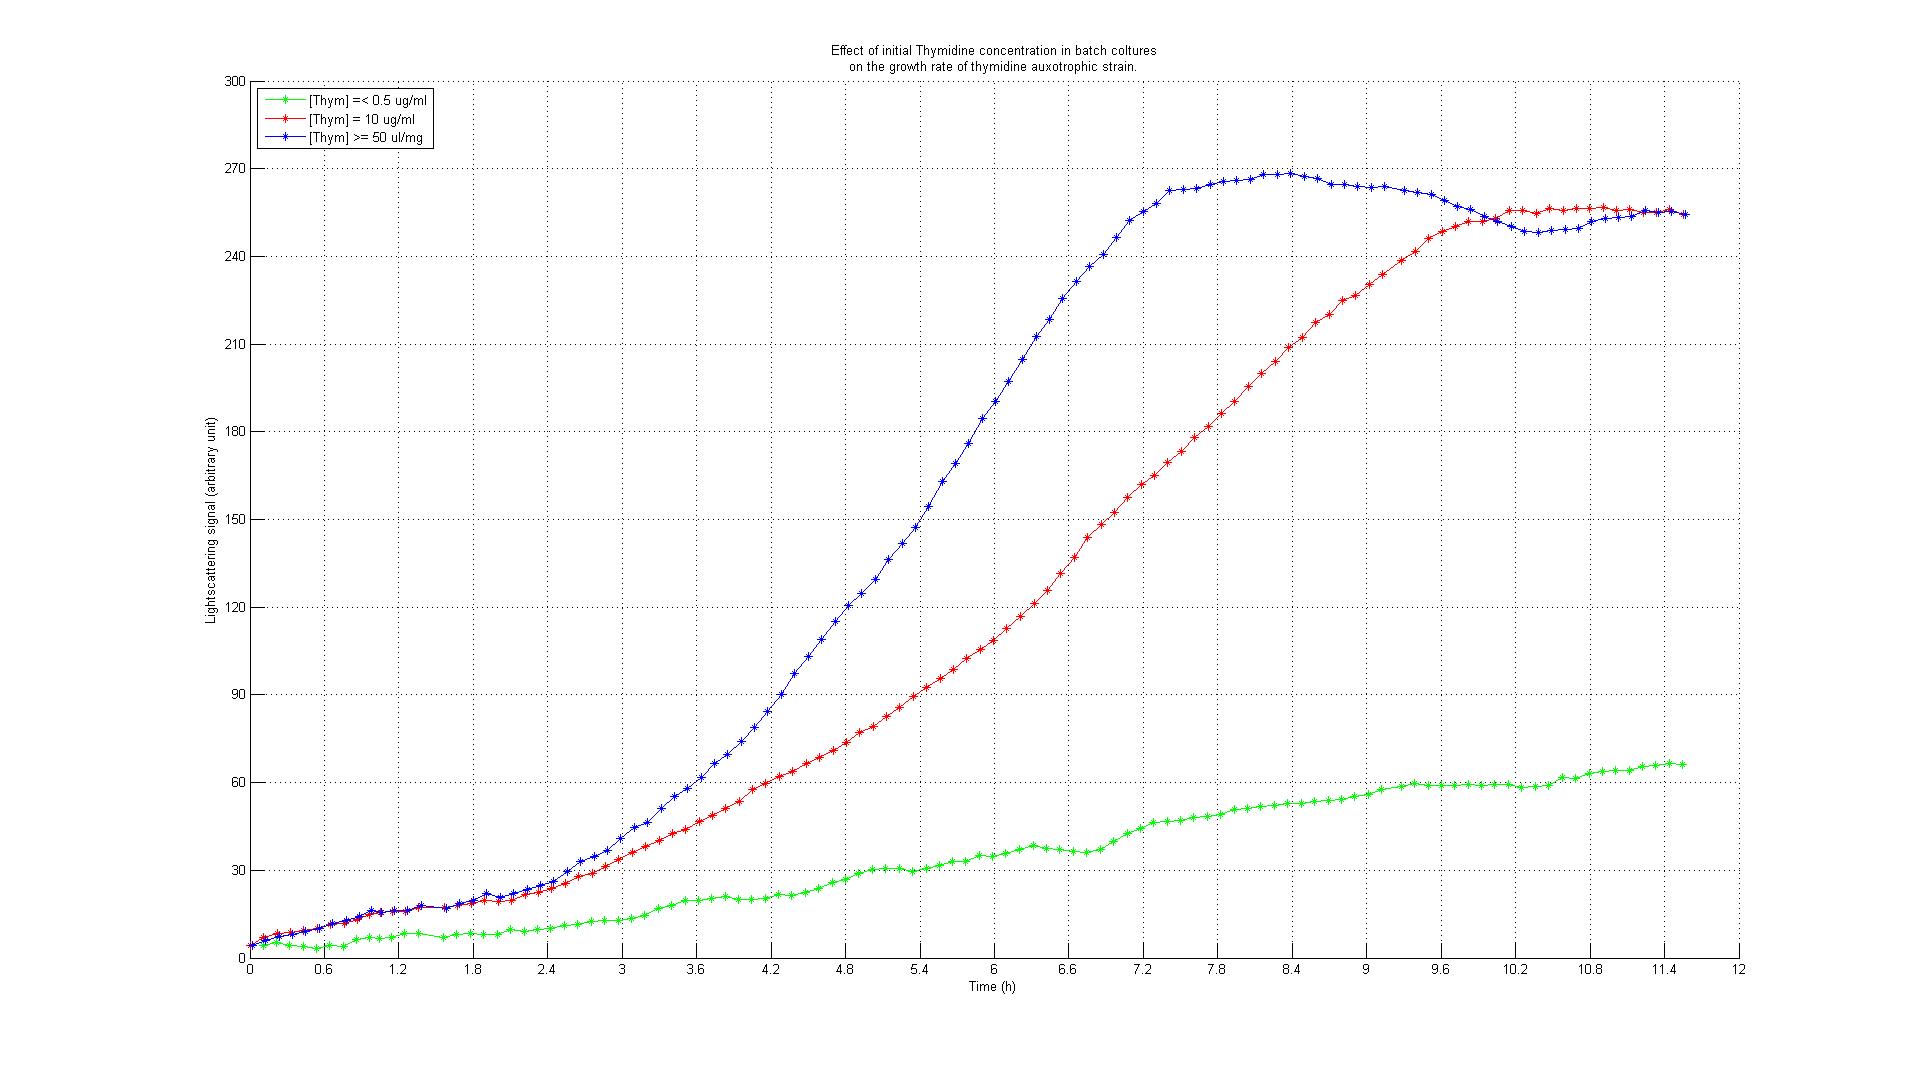
The underlying assumption is that a thymidylate synthase knockout can no longer synthesize DNA from glucose and thus depends entirely on the availability of thymidine in the medium. Therefore, if the thymidine concentration is kept low, DNA replication should be slowed down. A decreased replication rate then results in a slower growth rate. This way, by fixing the thymidine supply rate, we can influence the growth rate of the knockout mutant. Supporting our assumptions, Escartin et al. showed that an E. coli strain expressing an enzymatically less active thymidylate synthase shows a significantly lower incorporation rate of radioactively labeled thymidine into DNA indicating a reduced replication velocity (1). The same strain grows poorly in thymidine-deprived growth media. Other reports support that a decreased replication rate results in a slower growth rate and decreased replicative fitness (2). Lab resultsGrowth experiments with E. coli thymidine auxotrophic strain from KEIO libraryBefore we were able to perform knockout of thyA gene in our working strains (see section below), we decided to test thymidine concentration effects on growth rate by using an already available thymidine auxotrophic strain. Our question was to understand if growth rate could be controlled using different amount of thymidine concentrations in the medium. We used the thyA knockout strain from the KEIO library in an experiment performed using a BioLector machinery. The Biolector instrument takes lightscattering online measuraments each 5 minutes, from a 96 wells titer plate. The plate is shaked in a continuous fashion while oxygen exposure and humidity are kept constant. We devised an experiment in which different KEIO strain population were made to grow in different wells under different concentration of thymidine. The serie consisted of 8 different dilutions, with concentrations varying from 0.001, 0.050, 0.01, 0.5, 10, 50, 100 to 500 ug/ml, this in order to asses the range of effect. We add to the plate some controls: wild type strain subject to the very same concentrations auxotrophic strains without thymidine addition. The results are summarized in the experiment growth profiles here below. Growth rate was minimal (partly because of small false reading effect due to evaporation and moreover probably for some thymidine left from the overnight colture) in all the wells with 0.5 ug/ml or less thymidine concentration. For the wells with 0.50 ug/ml or more thymidine concentration we found a pattern of full growth. For the wells with 0.10 ug/ml we noticed a clear limitation in growth rate that put the growth profile in between the other two conditions. This effect was confirmed by two tecnical replicates. Controls showed the expected behaviour: thymidine deprived auxotrophic straind did not show any growth response and wild type strains grew according to a full growing profile under all the thymidine concentration conditions. This was an almost unexpected result that gave us two important evidences: thymidine concentration could be used effectively to control growth rate to a certain extent (extent yet to be fully characterized) and permitted us to identify the range of concentrations in which thymidine was supposed to be effective in controlling growth rate. Growth experiments with E. coli strains of different genomic sizesTo test our hypothesis of selecting for strains with smaller genome size in a chemostat setup, we have chosen to compare growth behaviour (growth rate and thymidine yield) of strains with different genome size. For this purpose we used MG1655 and MDS42, two strains with the same background, with different genome size. MDS2 has a 14.3% smaller genome size than MG1655. We ordered both at [http://www.scarabgenomics.com/ ScarabGenomics ].
For a first characterization of the growth behavior of these two strains, we performed growth experiments in LB medium.
We observed a higher growth rate for MG1655 than for MDS42 in LB medium, while growing to the same cell density. Labeling of E. coli strains of different genomic sizesSince growth of two strains in the same environment is not observable by measurement of the optical density, we decided to label them by expression of two different fluorescent proteins. We have constructed a RFP generator and a GFP generator on low-copy plasmids (pCK01) and transformed them into MG1655 and MDS42. An important issue, when labeling strains with different genome size in order to compare their genome size specific behavior, is to use plasmids with the same copy-number to keep the relative difference of needed amount of nucleotides the same. We have chosen to use a low-copy plasmid to keep the added protein burden low. To ensure that the fluorescence signal is proportional to cell concentration, we compared measurements of the optical density with fluorescence signal.
Thymidylate synthase knockout using phage transductionThe knockout of thyA in MG1655 and MDS42 were performed by P1 vir transduction (3). For this we used a thyA mutant from the [http://ecoli.naist.jp/gb6/Resources/deletion/deletion.html keio collection] as the donor cells to transfer its kanamicin-resistence gene into MG1655 and MDS42. The mutants from the keio collection are single knockouts which have each one single gene replaced by a kanamicin-resistence gene. Different verification methods were performed to verify successful knockout of thyA in MG1655 and MDS42. First we selected the transduced strains on kanamicin-plates, second we performed an XGal-test to distinguish colonies of the donor cells (keio thyA mutant) from the colonies of the receptor cells (MG1655 and MDS42) and third by growth on minimal glucose medium with and without supplemented thymidine (40ug/ml). Since BW25113, the strain of the keio collection, is lac- (∆lacZ4787(::rrnB-3)) and MG1655 and MDS42 lac+, XGal-screen is a fast method to distinguish residual donor cells in the phage lysate from the receptor cells. For further verification we will perform a colony PCR of the mutants. Growth experiments with thymidylate synthase knockout strainsWe performed growth experiments with the knockout mutants in minimal glucose medium with different thymidine concentrations.
What does this graph show ? Keio thymidylate synthase knockout strainsBW25113: ∆(araD-araB)567, ∆lacZ4787(::rrnB-3), lambda-, rph-1, ∆(rhaD-rhaB)568, hsdR514 JW2795 7 90 11 D B2827 thyA Phage transduction knockout strainsMG16555 thyA: F-, lambda-, rph-1, thyA- MDS42 thyA: F-, lambda-, rph-1, thyA- References(1) [http://www.pnas.org/content/105/29/9948 Escartin F., Skouloubris S., Liebl U., Myllykallio H. (2008): Flavin-dependent thymidylate synthase X limits chromosomal DNA replication. Proc Natl Acad Sci 22 105(29):9948-52.] (2) Helmstetter C. (1996): Timing of synthetic activities in the cell cycle. Escherichia coli and Salmonella: Cellular and Molecular Biology. eds Neidhardt FC et al. (Am Soc Microbiol, Washington D. C.): 1627–1639. (3) [http://mrw.interscience.wiley.com/emrw/9780471142720/cp/cpmb/article/mb0117/current/html Lynn C. et al. (2007): E. coli Genome Manipulation by P1 Transduction. Current protocols in molecular biology] (4) [http://www.sciencemag.org/cgi/content/full/312/5776/1044 Pósfai G, Plunkett G 3rd, Fehér T, Frisch D, Keil GM, Umenhoffer K, Kolisnychenko V, Stahl B, Sharma SS, de Arruda M, Burland V, Harcum SW, Blattner FR. Emergent Properties of Reduced-Genome Escherichia coli. Science. 2006 May 19;312(5776):1044-6. Epub 2006 Apr 27.] |
 "
"


