A. Genetic Engineering and Part Construction
A detailed summary of parts, design considerations, and genetic engineering progress can be accessed at the CONSTRUCTS page.
Please visit our Notebook for a summary of labwork and protocols.
B. Yeast Transformation
We are currently accumulating data for plasmid transformations into our brewing strain, SAB-Hefe. Data will be updated soon.
C. HPLC Data
To analyze our beer samples for resveratrol content, be will be using High Performance Liquid Chromatography (HPLC), which will allow us to separate the metabolites produced by the yeast and analyze these compounds by spectrophotometry. By comparing HPLC chromatogram peaks of metabolites produced by our yeast with a resveratrol-only standard, we can identify if resveratrol is being produced, and at what quantities. We will be monitoring the production of resveratrol and the consumption of p-coumaric acid, which will only be added to the media for the 4CL::STS-integrated yeast; the 4CL::STS+TAL will produce resveratrol with the need for supplemented p-coumaric acid (see STRATEGY). Below, we show our initial data for HPLC calibration curves using known quantities of trans-resveratrol and p-coumaric acid standards and test chromatograms using extracts from different wine samples.
- HPLC Parameters
- Instrument: Shimadzu LC-10AT liquid chromatography unit, SPD-10A UV-vis detector, and SCL-10A system controller.
- Column: Agilent Eclipse XDB-C18, 5uM (9.4x250mm)
- Mobile Phases:
- (A) 5% acetonitrile / 0.95% acetic acid
- (B) 70% acetonitrile / 0.3% acetic acid
- Linear gradient: A to B over 29 minutes
- Flow rate: 0.9mL/min
- Absorbance monitoring: 290nm
- Sample injection volume: 25 microliters
|
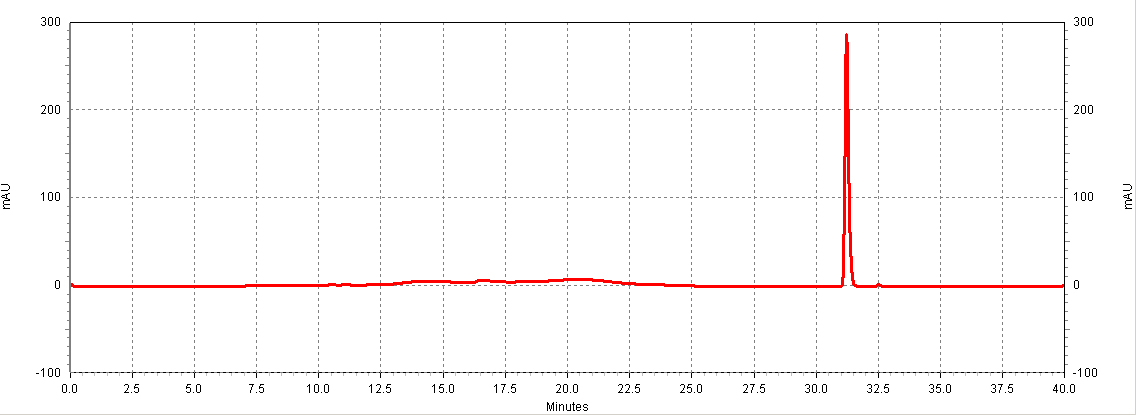 Figure C1. Example HPLC chromatogram of a trans-resveratrol standard.
HPLC: Calibration Standards
 Figure C2: trans-resveratrol standards (Sigma). Different serial dilutions are shown: 20 ug/mL (red), 10ug/mL (purple), 5ug/mL (blue), 2.5ug/mL (green). The inset shows the calibration curve (Peak area vs. Concentration).
 Figure C3: p-coumaric acid standards (Sigma). Different serial dilutions are shown: 18.5ug/mL (red), 9.25ug/mL (purple), 4.63ug/mL (blue), 2.3ug/mL (green).
 Figure C4: trans-resveratrol and p-coumaric acid have different retention times. This separation will allow us to resolve both molecules in a complex mixture, such as a yeast extract. Shown is 18.5ug/mL of p-coumaric acid and 20ug/mL of trans-resveratrol. The inset shows the calibration curve (Peak area vs. Concentration).
- All wine samples were extracted using 6 volumes of ethyl acetate. The ethyl acetate extracts were then evaporated under vacuum and resuspended with 70% methanol. Samples were kept in light-protected tubes until analysis.
- The results clearly show that red wines (Fig. C5) contain trans-resveratrol in significant amounts, whereas white wines (Fig. C6) do not, as expected.
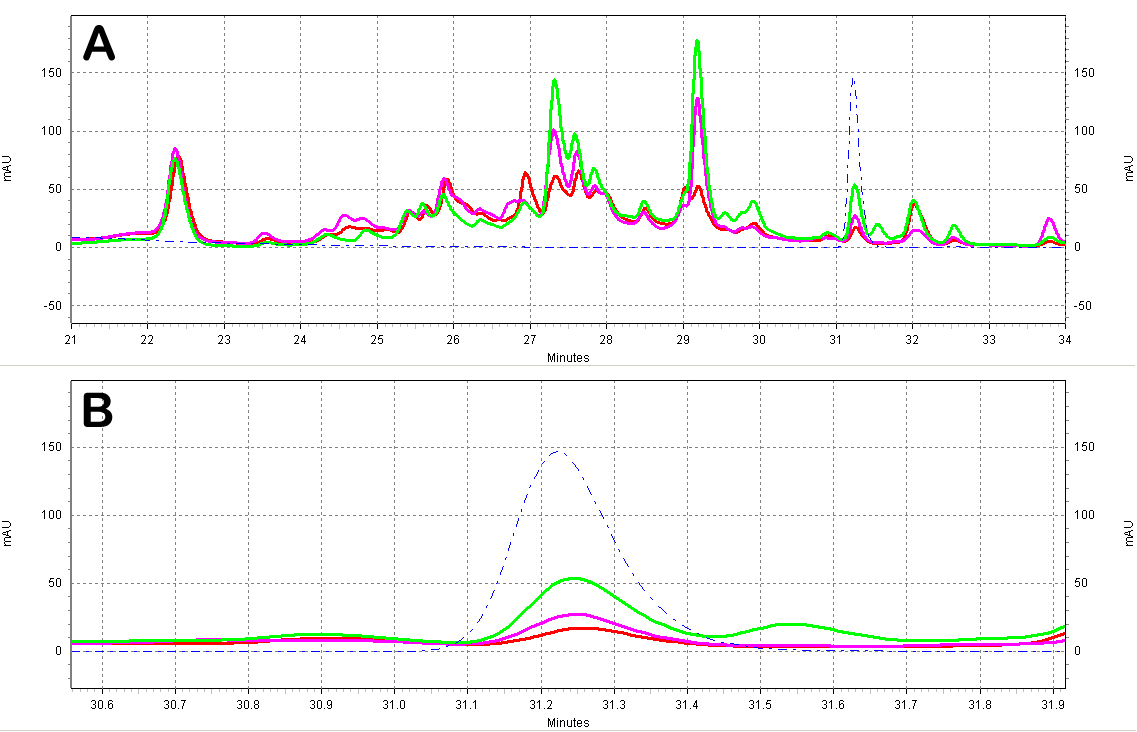 Figure C5: Red wine extracts analyzed by HPLC. A)Chromatogram of the red wine extracts; the different wines shown are a Merlot from Australia (red), a Shiraz from Australia (green), and a Primitivo from S. Italy (purple). Also shown is a trans-resveratrol standard (10ug/mL, blue dotted line). B)Zoomed-in view of the resveratrol peak region.
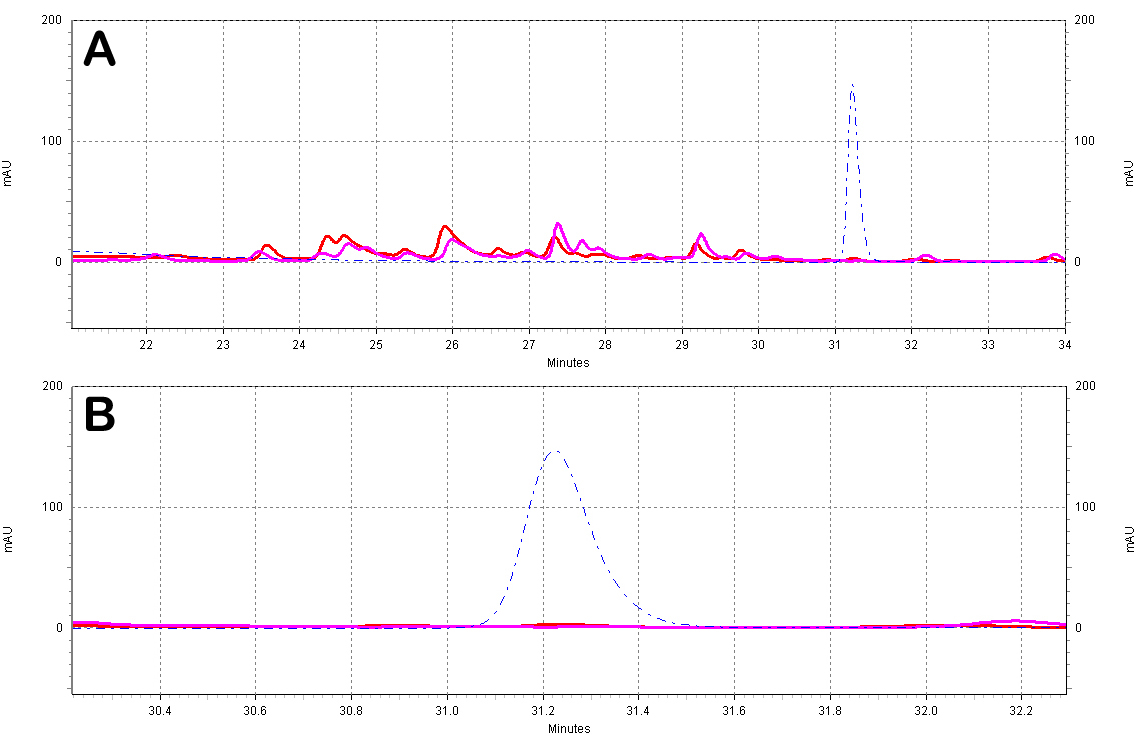 Figure C5: White wine extracts analyzed by HPLC. A)Chromatogram of the white wine extracts; the different wines shown are a Sauvignon Blanc from France (red) and a Chardonnay from N. California (purple). Also shown is a trans-resveratrol standard (10ug/mL, blue dotted line). B)Zoomed-in view of the resveratrol peak region.
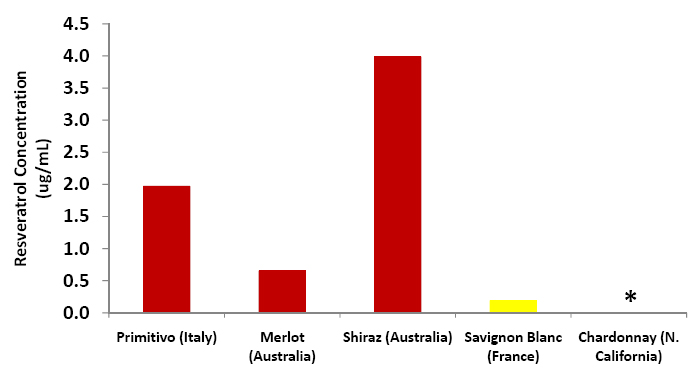 Figure C6: Resveratrol amounts as calculated using the above chromatograms and the calibration curve. Red wine samples are shown in red, white wine samples in yellow. The Chardonnay sample produced no detectable trans-resveratrol peak.
HPLC: beta-Glucosidase treated samples
- Some papers show that treatment of wine samples by beta-glucosidase increases the amount of resveratrol detected by converting glycosylated resveratrol (aka piceid) into its aglycone form.
- Our experiments indicate a marginal increase in trans-resveratrol detection by HPLC after treatment with 500U of beta-glucosidase (Fisher). Other wine varieties may contain a greater percentage of resveratrol in piceid form.
 Figure C7. beta-glucosidase treatment of wine samples. Shown is a Shiraz wine extract treated with beta-glucosidase (purple) or untreated (red). Also shown is a trans-resveratrol standard (10ug/mL, blue dotted line).
HPLC: Fermenation batches
We are currently in the process of transforming our yeast strain; HPLC data of the extracts for this strain will be added soon.
D. Fermentation Experiments
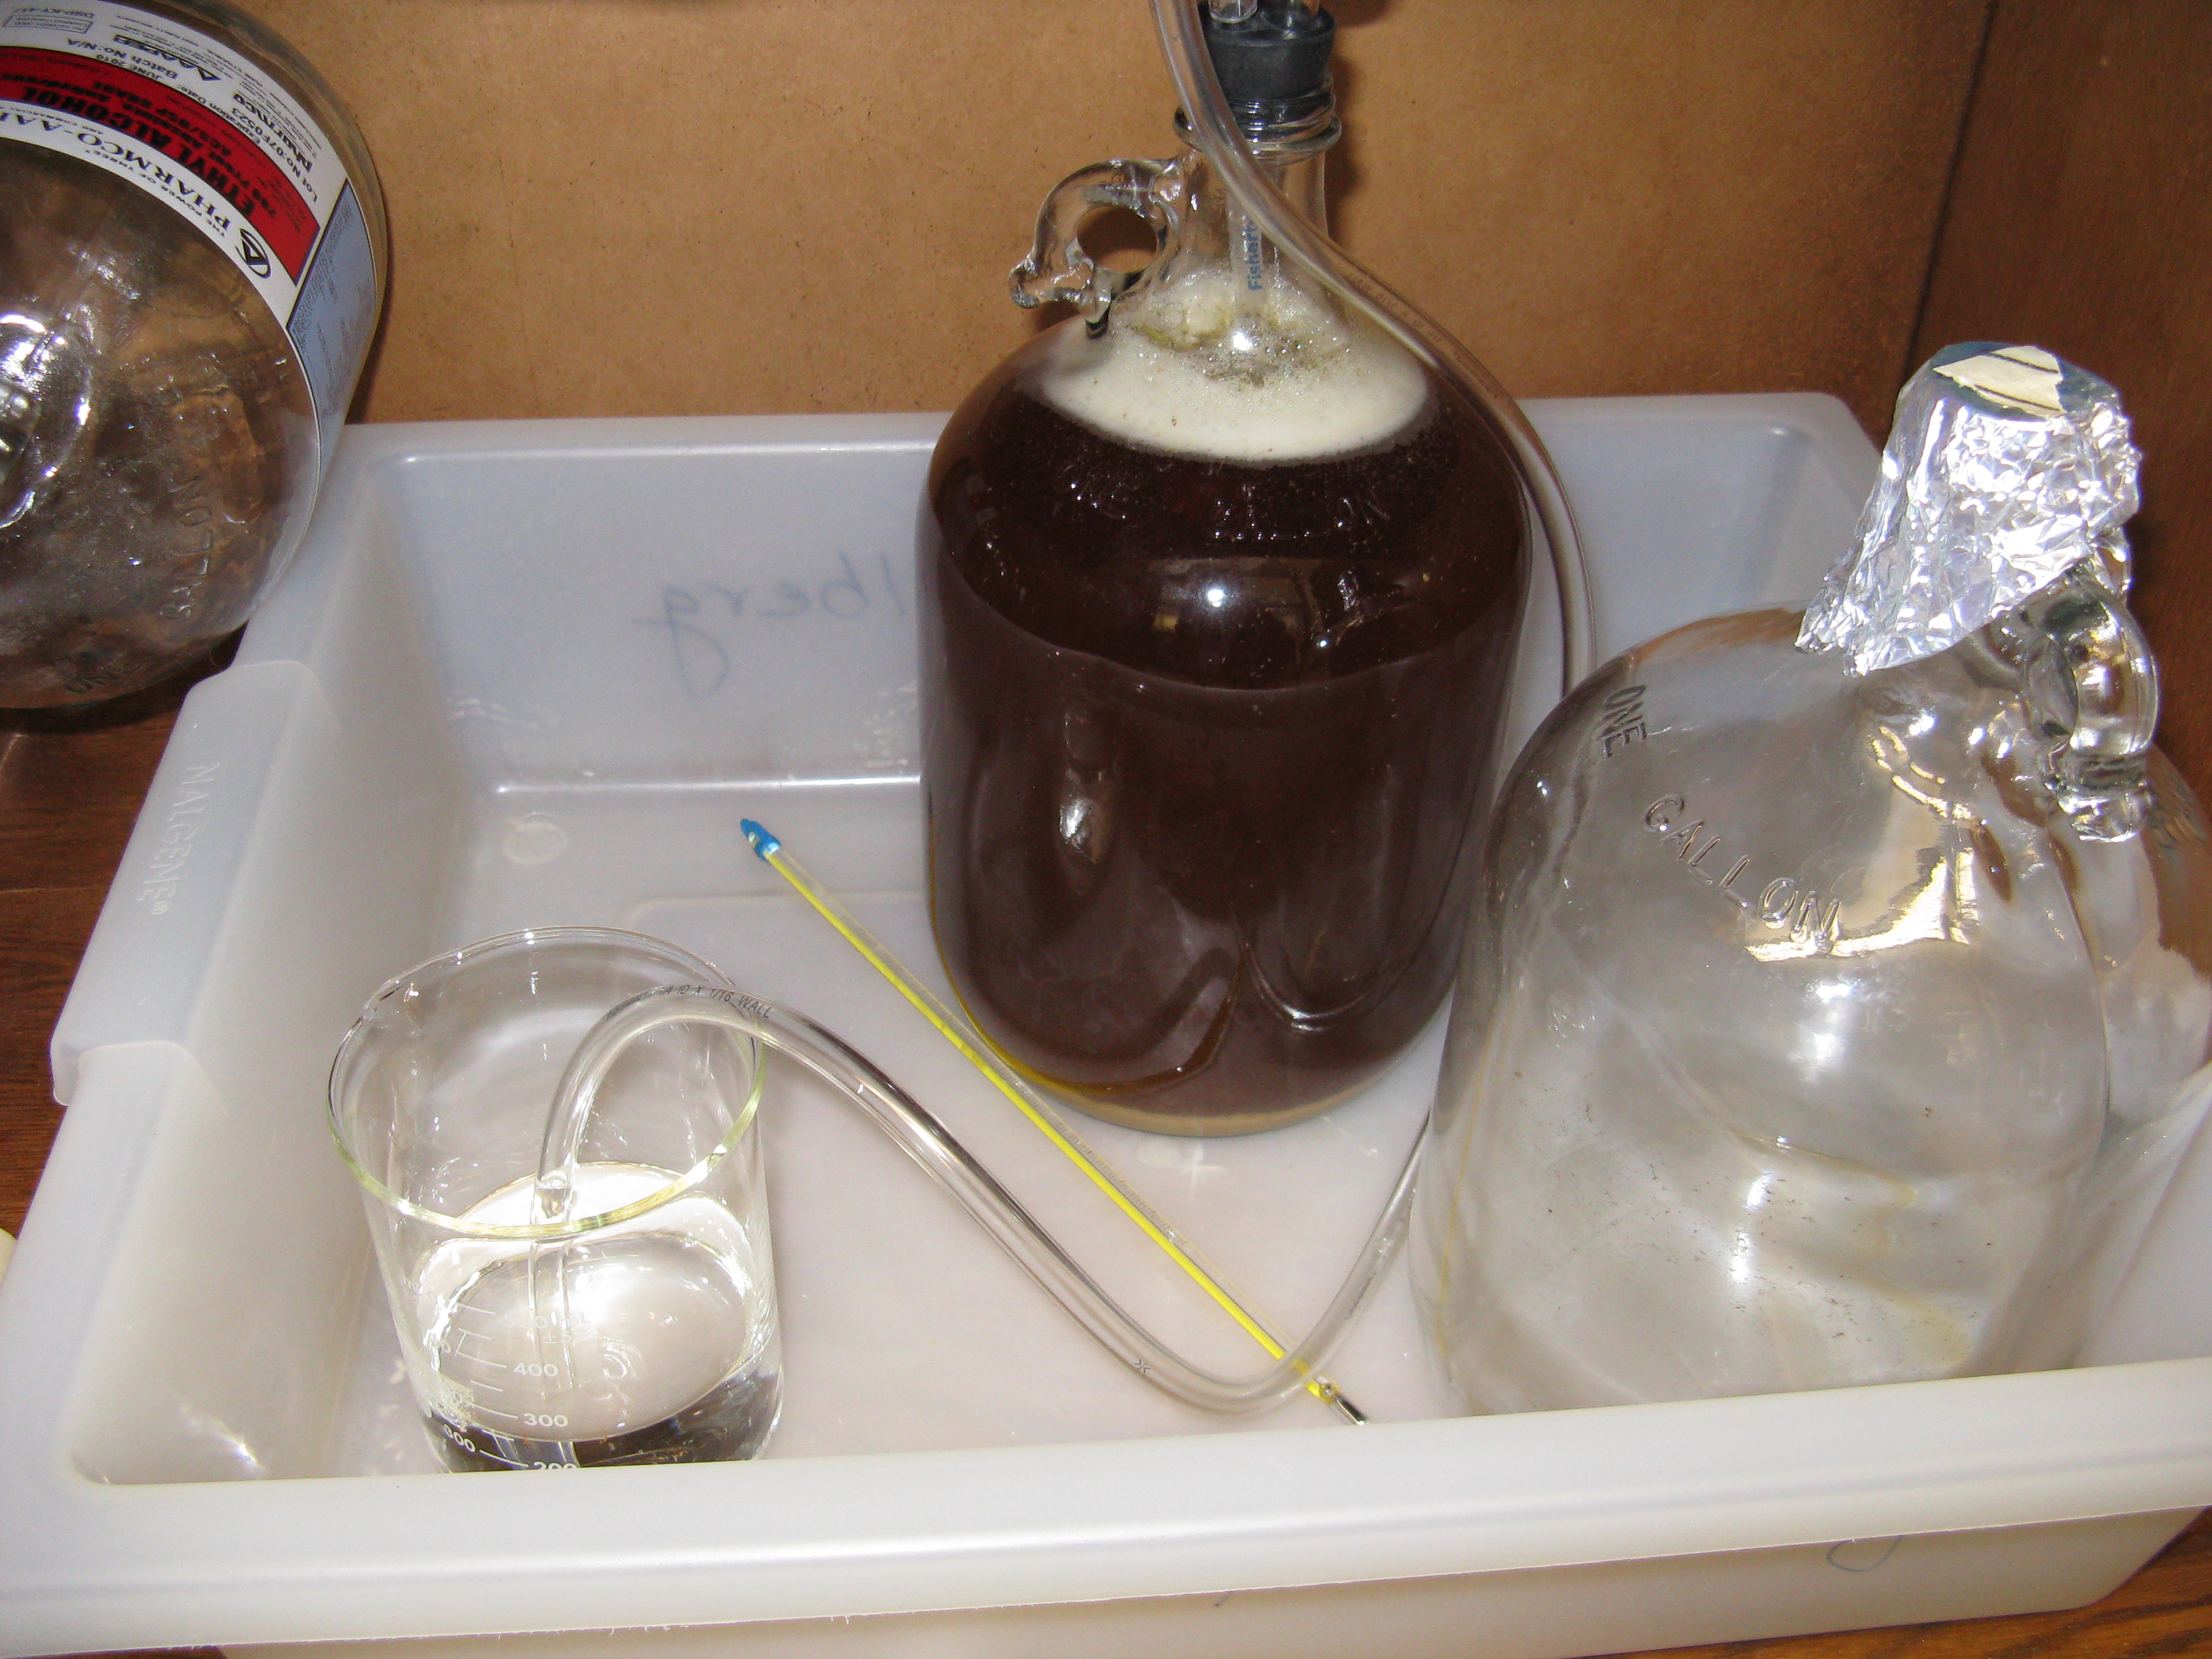 Figure D1. Test beer fermentation using the SAB-hefeweizen brewing strain provided by Saint Arnold Brewery (Houston, TX).
More experimental data coming soon. For a sneak preview, check out the Gallery
|