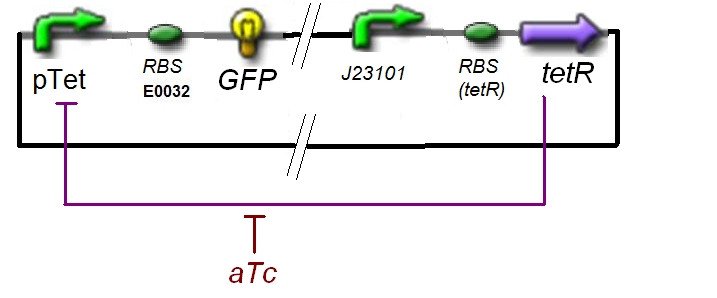
Team:Paris/Modeling/f1
From 2008.igem.org
The experience would give us
Thus, at steady-state and in the exponential phase of growth :
| param | signification | unit | value | comments |
| [expr(pTet)] | expression rate of pTet with RBS E0032 | nM.min-1 | need for 20 measures with well choosen [aTc]i | |
| γGFP | dilution-degradation rate of GFP(mut3b) | min-1 | 0.0198 | Time for Cell Division : 35 min. ; No degradation |
| [GFP] | GFP concentration at steady-state | nM | need for 20 measures | |
| (fluorescence) | value of the observed fluorescence | au | need for 20 measures | |
| conversion | conversion ration between fluorescence and concentration | nM.au-1 | (1/79.429) |
| param | signification corresponding parameters in the equations | unit | value | comments |
| βtet | production rate of pTet with RBS E0032 β1 | nM.min-1 | ||
| (Ktet/{coeftetR}) | activation constant of pTet K20 | nM | The optimisation program will give us (γ Ktet / {coeftetR} ƒ0) The literature [?] gives Ktet = | |
| ntet | complexation order of pTet n20 | no dimension | The literature [?] gives ntet = | |
| KaTc | complexation constant aTc-TetR K19 | nM | The literature [?] gives KaTc = | |
| naTc | complexation order aTc-TetR n19 | no dimension | The literature [?] gives naTc = |
Also, this experiment will allow us to know the expression of ƒ1 :
 "
"


