Team:KULeuven/Data/Input
From 2008.igem.org
Contents |
Input
Introduction
The purpose of our input is to be able to switch our systems on and off. Our first idea was therefore to use a light sensor as input. This could then be switched on/off by light. This would be very handy, since light is non-invasive, easily switched on/off and there is no problem with diffusion, intake or removal of chemicals. Unfortunately, there seemed to be a lot of troubles with the light sensor in the registry: [http://partsregistry.org/Part:BBa_M30109 M30109]. So we decided to use a chemical switch anyway and our final input now consists of a tetR generator. This generator will constitutively produce the tet repressor (tetR) and will hereby switch off every device that is under the control of a tet promoter (output and filter in our case). However, this can be reversed by adding anhydrotetracyclin (aTc). When aTc is added, it will bind to the tet repressor. This will inactivate the repressor and transcription from a tet promoter can occur - the systems will be switched on. When aTc is removed, tetR will become active again and the system will be switched off again. So, the tetR generator can work as a switch in combination with aTc.
To test this system, we built this tetR generator (input) and combined it with a GFP under the control of a tet promoter. When no aTc is present, the production of GFP should be switched off and there should be no fluorescence detectable. When aTc is added, GFP should be expressed and fluorescence should become detectable. One would also expect that one would detect more fluorescence if more aTc is added. We tested all this by measuring the fluorescence with a fluorescence-activated cell sorting (FACS) apparatus.
Materials and methods
Media
The media used were Luria-Bertani (LB) medium or agar plates. LB medium was used to make liquid cultures (composition on [http://openwetware.org/wiki/LB OWW]). The LB-agar plates were used to plate cells. These media also contained ampicillin (100µg/ml).
Constructing plasmids
We first wanted to make the construct J23116+B0032+C0040+B0015. But we had a lot of problems with ligating J23116 to B0032. We therefore replaced B0032 with B0034. The GFP under tetR control was constructed from R0040 and E0240. Thus, the constructs to be made were:
| [http://partsregistry.org/Part:BBa_K145201 K145201] | [http://partsregistry.org/Part:BBa_I7101 I7101] |
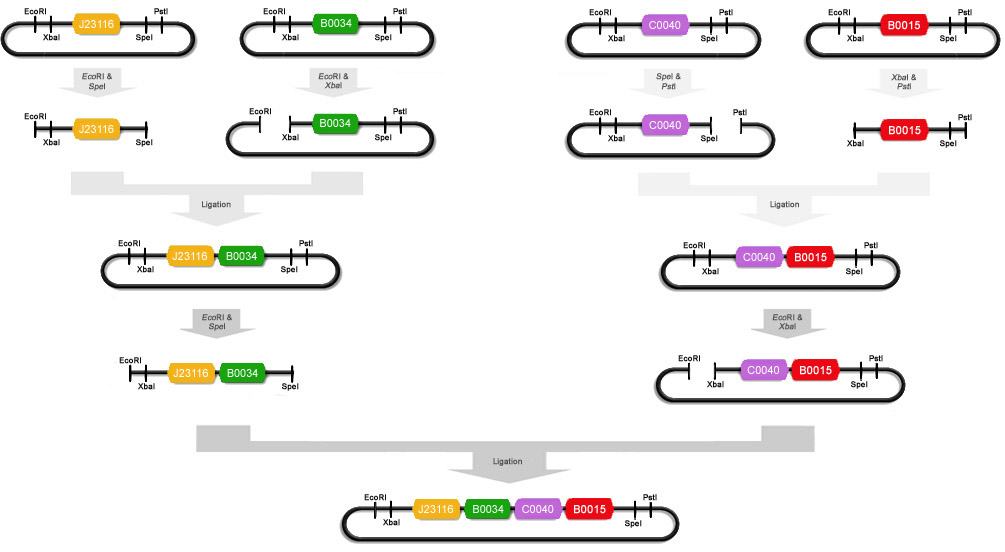
To make the input ([http://partsregistry.org/Part:BBa_K145201 K145201]), we miniprepped [http://partsregistry.org/Part:BBa_J23116 J23116], [http://partsregistry.org/Part:BBa_B0034 B0034], [http://partsregistry.org/Part:BBa_C0040 C0040] and [http://partsregistry.org/Part:BBa_B0015 B0015]. After that J23116 was digested with EcoRI and SpeI, B0034 with EcoRI and XbaI, C0040 with PstI and SpeI and B0015 with XbaI and PstI. We ligated some of these digests with T4 DNA polymerase : J23116+B0034 and C0040+B0015. These ligations were then electroporated into Top10 cells and the obtained colonies were miniprepped. J23116+B0034 was then cut with EcoRI and SpeI and C0040+B0015 was cut with EcoRI and XbaI. These digests were ligated to obtain part K145201: (J23116+B0034)+(C0040+B0015). This plasmid was then electroporated into Top10 cells. A schematic of this ligation procedure is shown below:
In order to make the GFP under tetR control ([http://partsregistry.org/Part:BBa_I7101 I7101]), we miniprepped [http://partsregistry.org/Part:BBa_R0040 R0040] and [http://partsregistry.org/Part:BBa_E0240 E0240]. After that R0040 was cut with EcoRI and SpeI, and E0240 was cut with XbaI and EcoRI. These two digests were then ligated to each other with T4 DNA ligase. This ligated plasmid was then electroporated into Top10 cells and plated on agar plates.
Now that we had cells with K145201 and with I7101, we could construct the real test module. Therefore, K145201 and I7101 were miniprepped and digested with EcoRI/SpeI and EcoRI/XbaI respectively. These two digests were then ligated to obtain part [http://partsregistry.org/Part:BBa_K145279 K145279]. This is the plasmid that was used in our experiments. It is shown below.
Measuring fluorescence of single cells
Electrocompetent Top10 cells were electroporated with [http://partsregistry.org/Part:BBa_K145279 K145279]. These cells were plated out on agar plates with ampicillin and grown overnight (37°). From this, ten 5ml liquid cultures supplied with 100 µg ampicillin / ml were prepared and also grown overnight (37°C). These cells were inoculated in fresh LB medium (100 µg ampicillin / ml) in the morning and grown at 37°C for 3.5h. Then anhydrotetracyclin was added.
Different amounts of aTc were added to the different cultures. A range of 0, 10, 20, 30, 40, 50, 60, 80, 100 and 140 ng/ml anhydrotetracyclin was prepared. These ten liquid cultures were then allowed to grow for another 3h (37°C). After that, the cells were diluted into PBS and analyzed by flow cytometry with a Becton Dickinson FACSCalibur and CELLQuestTM acquisition and analysis software with gates set to forward and side scatters characteristic of the bacteria (Gate G2=R2).
The fluorescence of the cultures containing 0, 50 and 100 ng/ml anhydrotetracyclin was also followed in time. These cultures were withdrawn at different time intervals (0, 10, 20, 30, 45, 60 and 192 minutes) and then the fluorescence was measured with FACS. This was again done by diluting the cells into PBS and analyzing them by flow cytometry with a Becton Dickinson FACSCalibur and CELLQuestTM acquisition and analysis software with gates set to forward and side scatters characteristic of the bacteria (Gate G2=R2).
Results and discussion
Plasmids
The construction of the plasmids took quite long, but it eventually succeeded. Sequencing showed that K145201 and K145279 contained the right parts. The colonies of the bacteria with I7101 were fluorescent and the colonies with K145279 were not, which indicated that the constructs were probably correct.
Concentration dependency
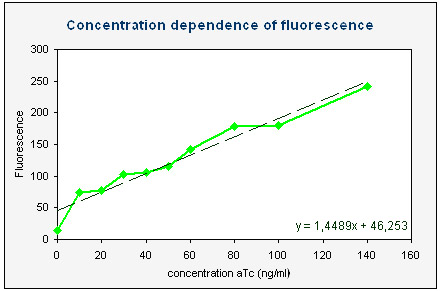
We made liquid culture of colonies with K145279, containing 0, 10, 20, 30, 40, 50, 60, 80, 100 and 140 ng/ml anhydrotetracyclin. After 3 hours the fluorescence was measured with FACS. With CELLQuestTM analysis software a histogram of the fluorescence (channel FL1-H) was made and the mean of the fluorescence was calculated. With Excel a plot was made of this average fluorescence as a function of the aTc concentration (see left). This graph clearly shows that more aTc results in more fluorescence. Significant results can already be obtained by adding 10 ng/ml anhydrotetracyclin, but more fluorescence can be measured with higher aTc concentrations. Our measurements show that one can easily add up to 140 ng/ml aTc without killing the cells and thus obtaining high fluorescence output.
Time dependency
We made liquid culture of colonies with K145279, containing 0, 50 and 100 ng/ml anhydrotetracyclin. These cultures were withdrawn after 10, 20, 30, 45, 60 and 192 minutes and the fluorescence was measured with FACS. With CELLQuestTM analysis software a histogram of the fluorescence (channel FL1-H) was made and the mean of the fluorescence was calculated. With Excel a plot was made of this average fluorescence as a function of time (see below). These graphs clearly show that adding aTc induces the transcription of GFP from the tet promoter. One can see a rapid increase in fluorescence in the first hour after aTc has been added. After that the fluorescence remains relatively stable – it increases only slightly. The graphs also show that higher concentrations of aTc result in more fluorescence.
Conclusions
We can conclude that the parts K145201 and K145279 behave as expected. TetR is indeed constitutively produced and will therefore switch off the production of GFP. The addition of aTc can switch on the production of GFP. This happens almost instantly, since fluorescence can already be detected after 15 minutes (but it will keep on rising in the first 90 minutes or so until reaching a platform). It was also shown that higher concentrations of anhydrotetracyclin result in more fluorescence.
 "
"


