Team:EPF-Lausanne/Modeling
From 2008.igem.org
| Home | The Team | The Project | Parts | 2-step PCR | Microfluidics | Modeling | Notebook |
|---|
Contents |
The Challenge...
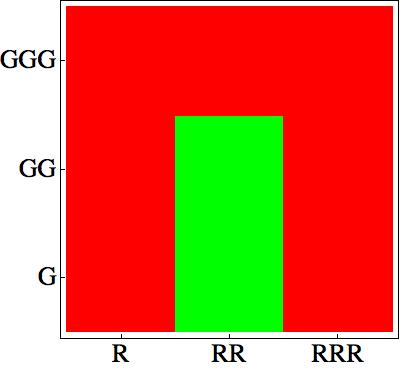
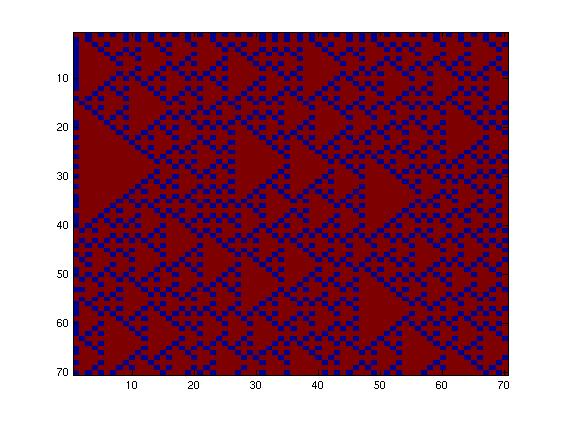
First of all, as described in the Project description, we choose some rules which give a nice pattern:
How can we design a network which will implement these rules and result in a cell population which self-organizes to generate the pattern?
The main challenge in fact is to take into account that the cells sense their own AHL signaling molecules. Thus it will be hard to design a bistable network. Furthermore for a bistable network it should be possible to pass from one steady state to the other, by applying AHL concentration gradients to the cells
To solve this problem we will proceed in 2 steps: -Find the network exhibiting a transfer function corresponding to the rules without including
Double input model
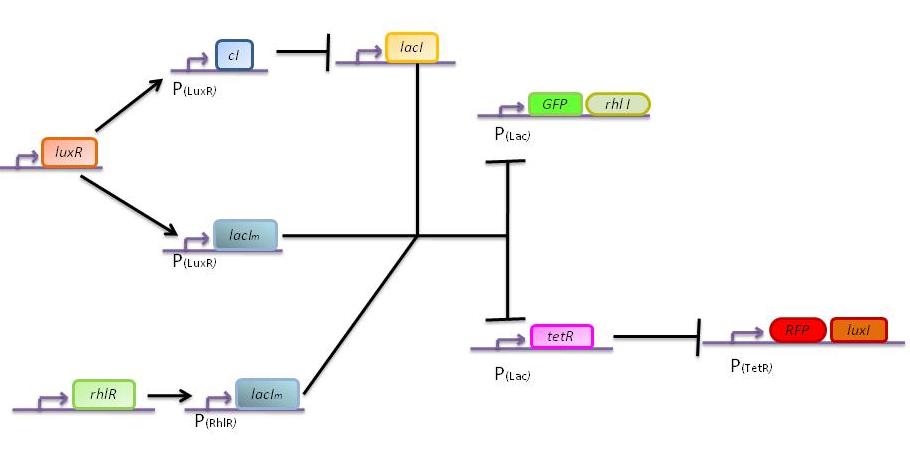
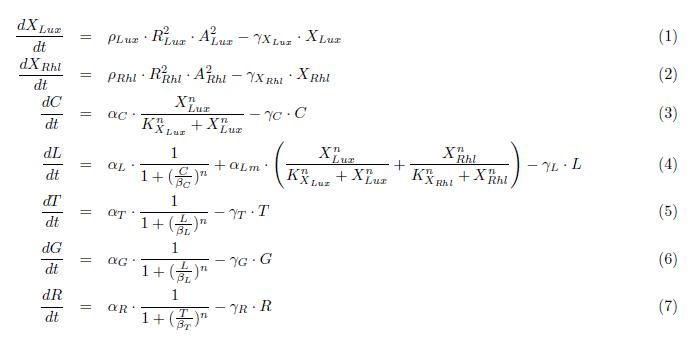
Here we describe a semi-quantitative model of the Lux band-pass detector and the Rhl high-pass detector. The model describes each proteins and sending molecules involved in the system. At this stage, we test the ability of the system to process a constant input of green or red (ALux or ARhl) and choose an output state, either red or green.
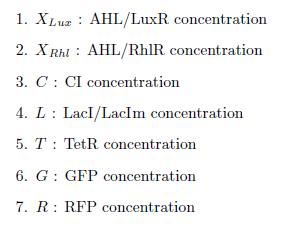
States
ODEs
Parameters
Simulation
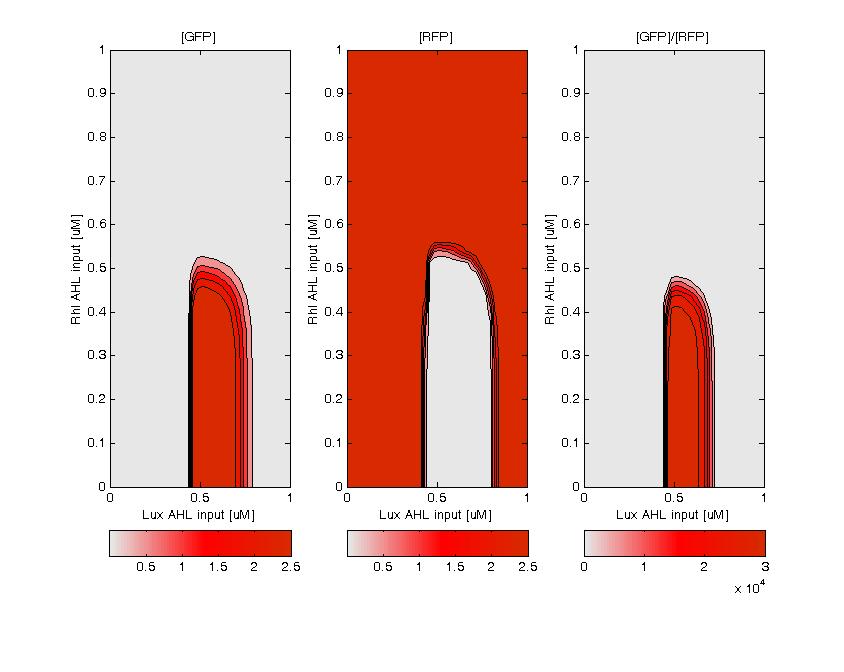
The model nicely shows that for a certain range of AHL concentrations, the system can turn into either green or red. the following figure shows that we can achieve the band-pass filter on the red input and a high pass on the green input. Therefore, we can generate the choosen rule set where only medium level of red (AHL Lux) and low to medium level of green (AHL Rhl) can turn the system into the green state.
Bistable switch model
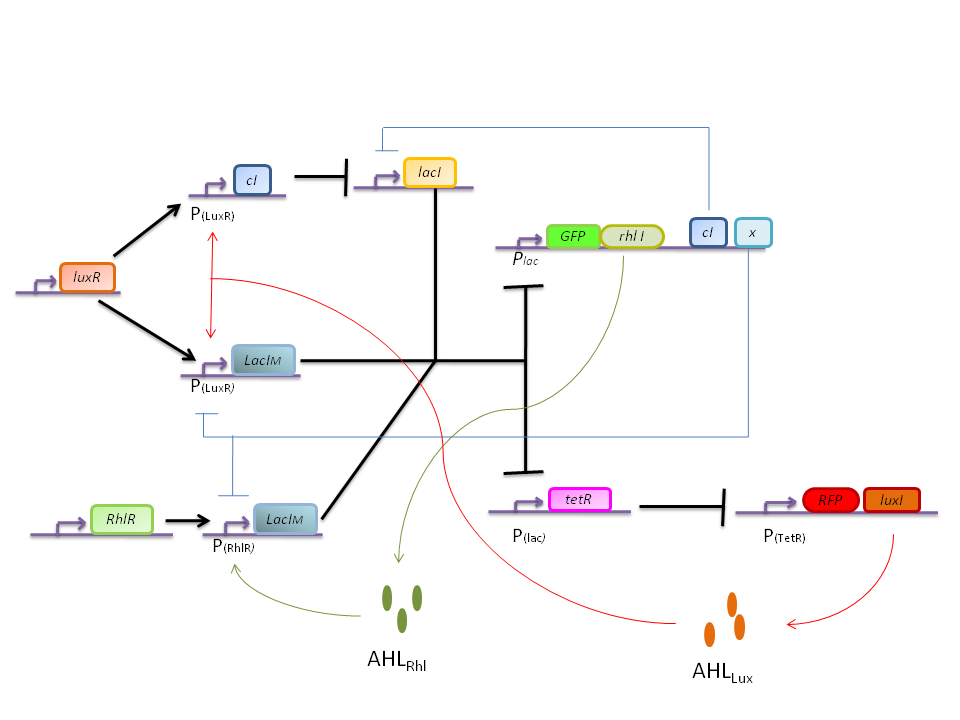
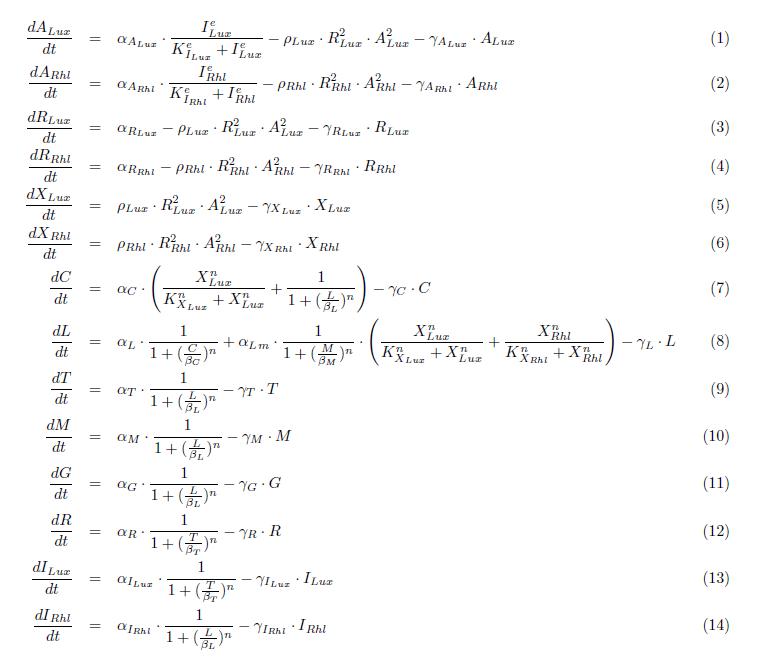
In this more complex model, we implemented the making of LuxI and RhlI in the cell, resulting in the self-production of AHL. We added two negative feedback loops (M and cI, blue arrows) that must help the system to lock itself into the green state. The red state is more stable than the green state and did not need any feedback to lock itself.
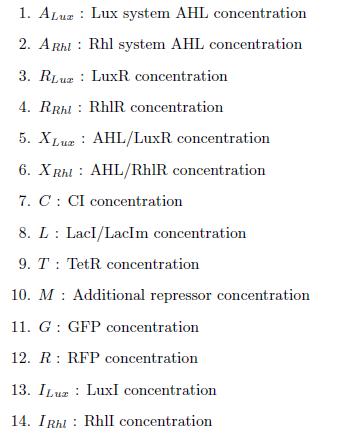
States
ODEs
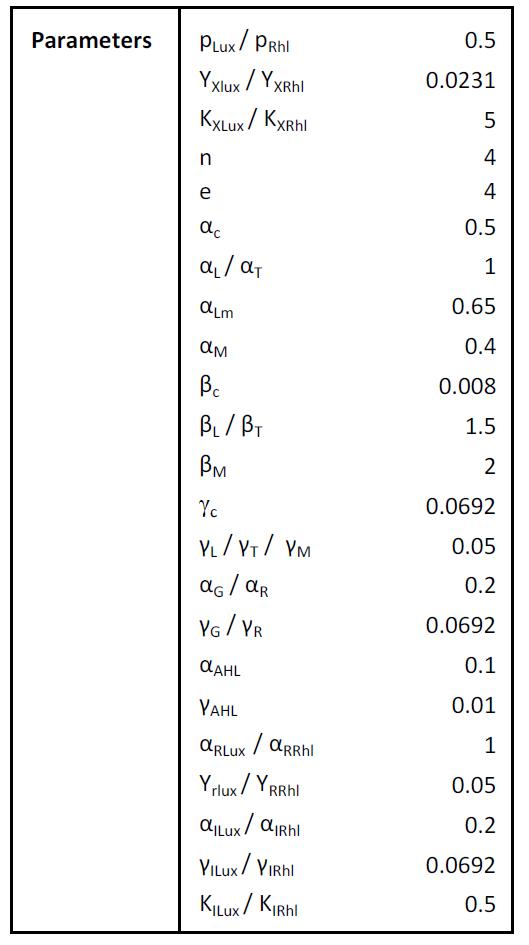
Parameters
Simulation
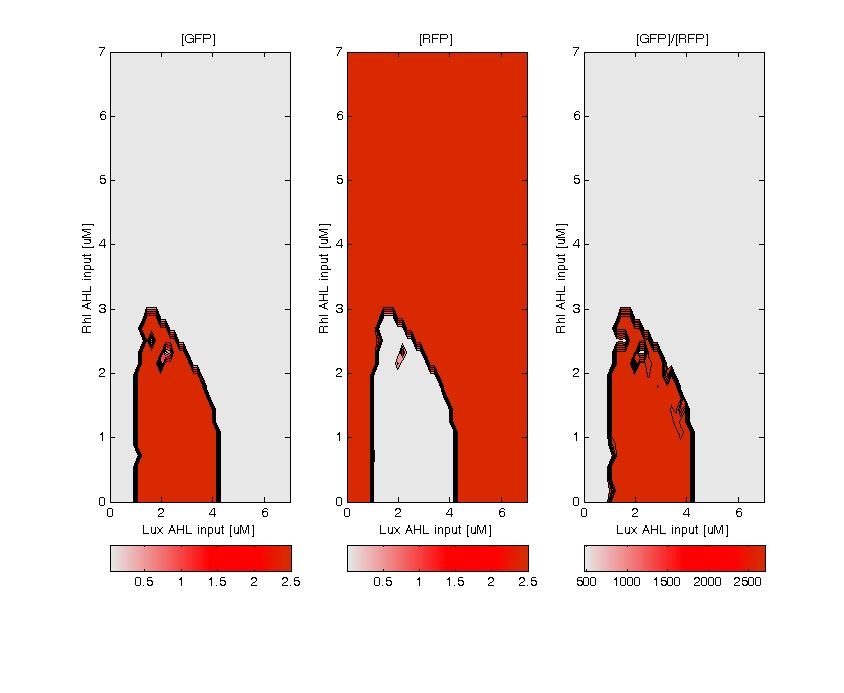
GFP (left) and RFP (middle) expression for concentration of AHL (Lux or Rhl) pulses. On the right, figure shows the ratio of GFP/RFP. This results shows that a given range of AHL can produce the green state. This is in good agreement with the rule set that we propose, where only medium level of red input (AHL Lux) and low to medium level of green input (AHL Rhl) can generate green.
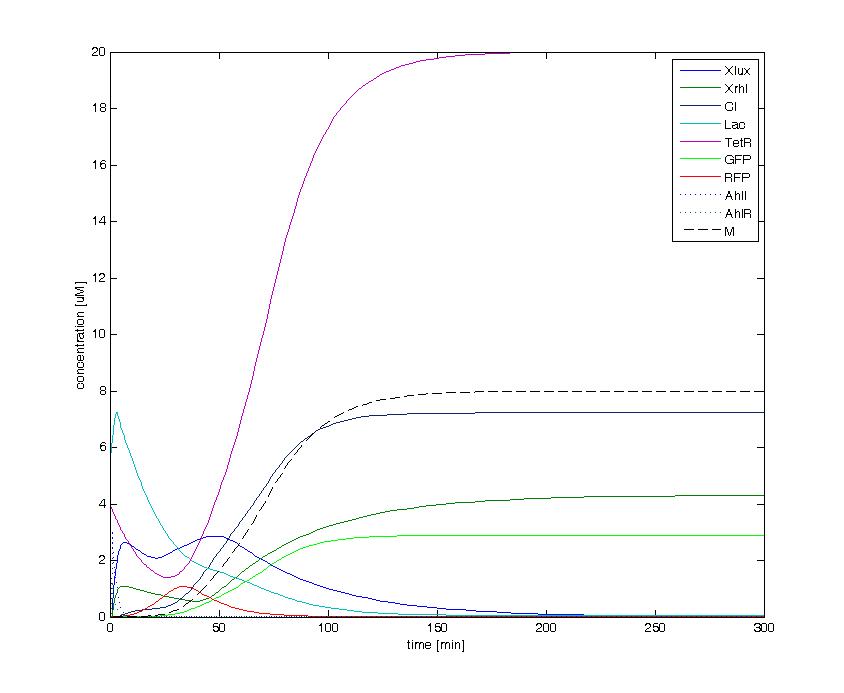
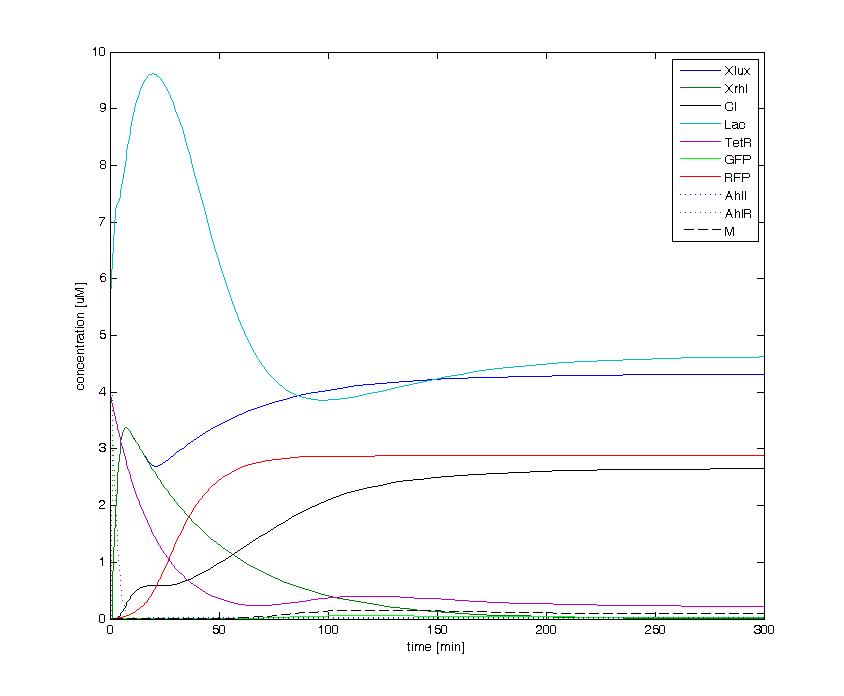
The following figures show the dynamics of the different states involved in the system for different AHL pulses. On the left, the system is locked into the green state after a pulse of 1.6 uM of Lux AHL and 3 uM of Rhl AHL. On the right, the system is locked into the red state after a pulse of 4 uM of Lux AHL and 4 uM of Rhl AHL. The model nicely shows the dominance of either TetR (purple line) or LacI (light blue line) for the green, respectively red state. It also shows the importance of the twos negative feedback made by the M represssor (dashed line) and cI (black line) to maintain the system in the green state.
 "
"
