Team:BCCS-Bristol/Modeling-GRN
From 2008.igem.org
Contents |
Gene Regulatory Networks (GRN) Modelling
The gene regulatory network controls the internal state of the cell. Ordinary differential equations were used to model the mRNA and protein concentration as they varied over time. As is common in the literature on gene regulatory networks [1], a Hill function of the following form was chosen to represent the non-linear dynamics of promoter activation,
In this equation X represents the ligand concentration, q is the dissociation constant and m is the Hill coefficient.
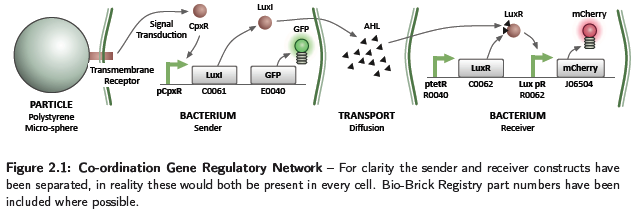
Due to time restrictions, the wet lab team concentrated on the co-ordination aspect of the construction rules, implementing the GRN shown in Figure 2.1. This relates to part 4 of the project approach, and the process of bacteria in contact with a particle being able to influence the behaviour of others in a close vicinity. The system consists of conceptually two separate parts, a sender and receiver. The sender is activated by a binding event, such as adhesion to a particle, causing the generation of a signalling chemical. This diffuses in the environment and on the receiver sensing a concentration above a threshold, causes activation and production of the mCherry fluorescent protein. Diffusion of chemicals at the concentrations produced by a cell will occur slowly, restricting the activation of receivers to a local area. A system of this type would be utilised to perform the short range co-ordination discussed in part 4 of the project approach, however, with activation causing a chemotactic response. Although the sender and receiver parts have been discussed separately, in reality both constructs are present in each cell.

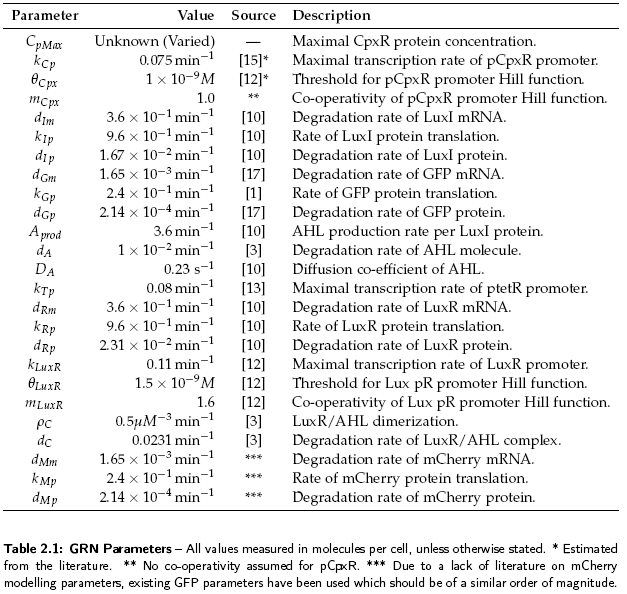
This section details the models developed to help understand the dynamics of the coordination GRN. For a description of parameters used in the models with their values, see Table 2.1. In all models the basal transcription rate has been assumed negligible.

Sender
The sender device consists of two genes (LuxI, GFP) and a single promoter (pCpxR). We are interested in the relationship between the activator protein CpxR and the production of the signalling compound N-acyl-homoserine lactone (AHL). AHL is produced by the LuxI enzyme which uses S-adenosylmethionine and the acylated-acyl carrier protein as substrates for the reaction. The concentration of the activator protein CpxR is specified as a contact profile mimicking the discovery of a particle. A linear piece-wise function was selected, ranging from 0 at t = 0, to a maximal CpxR protein concentration CpMax after 1 hour, taken from [2]. In the following equation time t is measured in minutes,

Both LuxI and GFP are controlled by the promoter pCpxR. In reality, because both genes are under the control of a single promoter, transcription would lead to the creation of a single mRNA strand. This mRNA would contain both genes, however, have separate ribosome binding sites (RBS) for each to allow for parallel translation. Due to the negligible effect on dynamics and a lack of information regarding degradation rates of this mRNA sequence, each gene transcription was treated separately. The transcription phase was modelled using a Hill function for the activation of the promoter with a degradation term for existing mRNA. This gives the following for mRNA concentrations of LuxI Im and GFP Gm:

Translation of the mRNAs into proteins of LuxI Ip and GFP Gp was modelled as proportional to the current mRNA concentrations minus a degradation term, yielding the model:

Transport
We were interested in understanding the relationship between AHL production at a point and the spatial concentration distribution over time. For the transportation of AHL between cells we assumed diffusion was the only process taking place. There is some evidence that AHL may be actively transported across cell membranes [3], however, by assuming only diffusion, a good indication of the worse case scenario could be gained. Assuming the diffusion co-efficient D is the same in all directions we have,

where f(r, t) is the concentration of the diffusing chemical at location r and time t. As evolution of the concentration distribution is the same in all directions, we only considered a 1-dimensional case. The following ‘Forward Time Centred Space’ (FTCS) discrete numerical scheme was used to calculate the time evolution of the system, namely we have:

where u is the is the chemical concentration, j is the discrete spatial index and n is the time index n, Dt is the time step, and Dx is the width of each spatial index. When computing the time evolution, the spatial environment was split into 1mm portions and a time step of 0.01s used.
Reciever
The receiver device consists of two genes (LuxR, mCherry) and two promoters (ptetR, Lux pR). We are interested in how the AHL concentration effects the output of our reporter protein mCherry. The protein LuxR is under the control of the constitutive promoter ptetR. This means that the promoter is permanently at its maximal transcription rate kTp, unless repressed. In our system, repression of the ptetR promoter is assumed to never occur. This allows the equation determining mRNA concentration of LuxR Rm to be simplified. The normal h+ term becomes equal to 1, removing the non-linearity. Degradation of the mRNA must also be considered to give the actual output concentration:

The activation of the Lux pR promoter, controlling mCherry output, is more complicated. To create a working transcription factor for Lux pR, two LuxR–AHL complexes form a dimer. To incorporate this feature we replicated the work in [4], modelling LuxR–AHL concentration CRA as:
Using this concentration for the LuxR–AHL complex as an input to the Hill function and including a standard degradation term, the mCherry mRNA concentration Mm can be modelled by:
Translation was modelled as being proportional to the mRNA concentration, minus a degradation term. Thus for LuxR and mCherry concentrations, Rp and Mp respectively, we have:

Integration of Sender & Reciever
To integrate the sender and receiver sub-systems it is necessary to consider a physical arrangement of cells. The requirement of a fixed configuration is due to the transport aspect of the system. Output from the sender device, cannot directly be fed into the equation determining the LuxR–AHL complex, because the transport phase will cause a delay and reduced concentration between the cells. Instead, the AHL concentration must be taken from the diffusion model, which requires a spatial position. By fixing cell locations and linking the equations in this way, it is possible to simulate the cellular signalling between the GRNs. We will concentrate on analysing the GRNs in isolation, however, attempt to use realistic values between them to ensure the dynamics exhibited are correct.
References
[1] Uri Alon. An introduction to systems biology: Design principles of biological circuits. Jan
2007.
[2] K Otto and T Silhavy. Surface sensing and adhesion of Escherichia coli controlled by the
Cpx-signaling pathway. Proceedings of the National Academy of Sciences, Jan 2002.
[3] C Fuqua, M Parsek, and E Greenberg. Regulation of gene expression by cell-to-cell communication:
Acyl-homoserine lactone quorum sensing. Annual Reviews in Genetics, Jan 2001.
[4] S Basu, Y Gerchman, C Collins, F Arnold, and R Weiss. A synthetic multicellular system
for programmed pattern formation. Nature, Jan 2005.
 "
"