 "
"
File:Fig 12-081023-P-K 100-1 growth curve.png
From 2008.igem.org
Revision as of 02:01, 29 October 2008 by Andreaskuehne (Talk | contribs)
Size of this preview: 800 × 521 pixels
Full resolution (1,502 × 978 pixels, file size: 187 KB, MIME type: image/png)
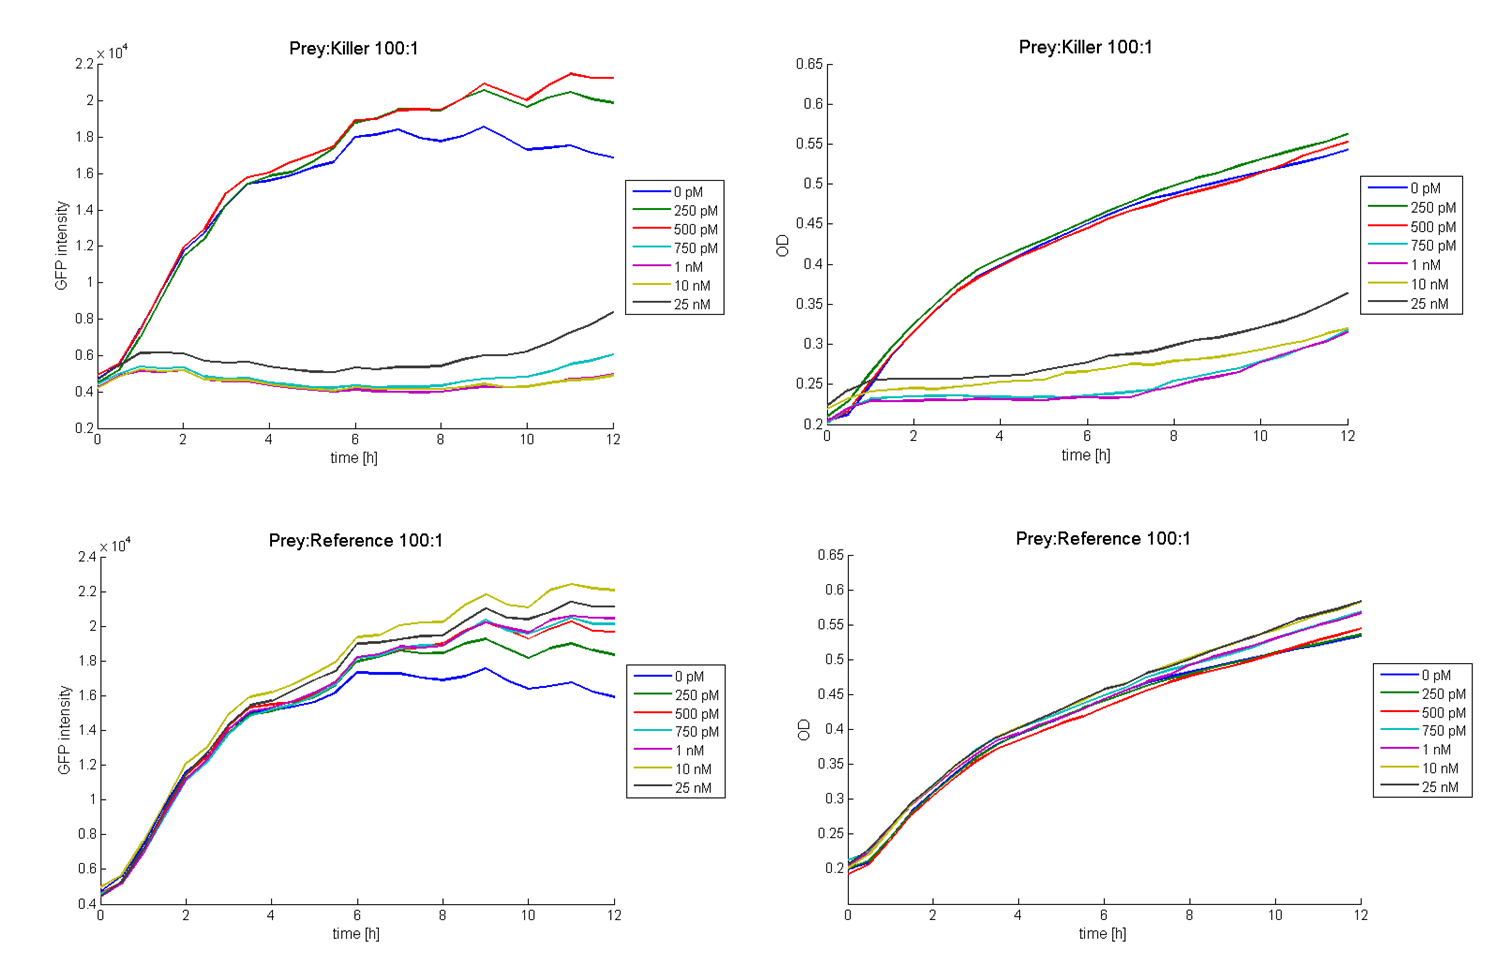
Results of colicin E1 toxicity tests for different AHL concentrations with a prey-killer ratio of 100:1. Top left panel: GFP intensities of prey cells treated with killer cells. Top right panel: Optical densities of prey cells treated with killer cells. Bottom left panel: GFP intensities of prey cells treated with reference cells. Top right panel: Optical densities of prey cells treated with reference cells. The graphs proof the toxicity of colicin E1as well as the functionality of our part. Each killer cell is able to kill up to 100 prey cell if there is a sufficient amount of AHL present.
File history
Click on a date/time to view the file as it appeared at that time.
| Date/Time | Thumbnail | Dimensions | User | Comment | |
|---|---|---|---|---|---|
| current | 02:01, 29 October 2008 | | 1,502×978 (187 KB) | Andreaskuehne (Talk | contribs) | (Results of colicin E1 toxicity tests for different AHL concentrations with a prey-killer ratio of 100:1. Top left panel: GFP intensities of prey cells treated with killer cells. Top right panel: Optical densities of prey cells treated with killer cells. ) |
File links
The following 2 pages link to this file: