IGEM:Cambridge/2008/Notebook/Voltage/OD600 Calibration
From 2008.igem.org
(Difference between revisions)
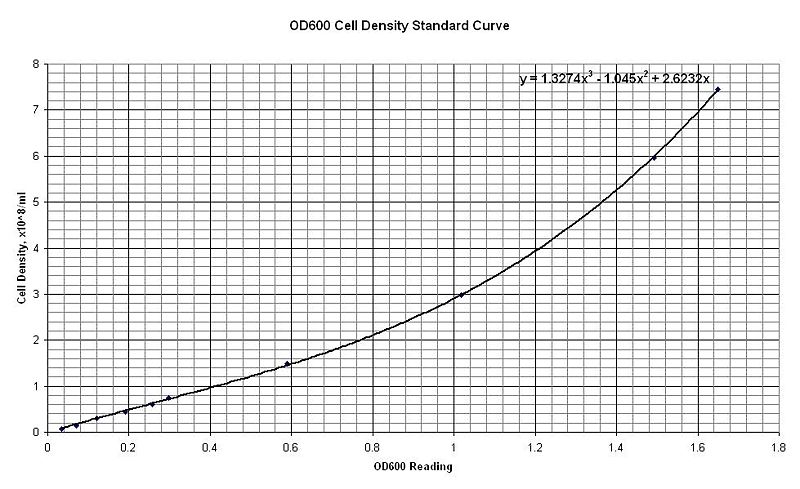
(New page: =Method= *An LB culture of TOP10 cells was serially diluted and the OD600 reading was taken for each. (UV/Vis Spectrophotometer zeroed using LB.) *Dilutions were plated out at 10<sup>-5</s...) |
|||
| Line 1: | Line 1: | ||
| + | {{Cambridge/Notitle}} | ||
| + | <div class=bodytable> | ||
| + | {{Cambridge08}} | ||
| + | {{Cambridge08voltage}} | ||
| + | <html> | ||
| + | <table style="background:#444444; padding:15px;"> | ||
| + | <table align=left width= border="0" style="background:#444444; padding:5px;"> | ||
| + | <tr> | ||
| + | <td style="width:100%; height: 400; padding-left: 15px;"> | ||
| + | <b class="b1f"></b><b class="b2f"></b><b class="b3f"></b><b class="b4f"></b> | ||
| + | <div class="contentf"> | ||
| + | <div style="height: 400; background: white; line-height:170% padding: 5px;"> | ||
| + | <div style="color: white; font: 2px;">x</div> | ||
| + | </html> | ||
| + | |||
=Method= | =Method= | ||
*An LB culture of TOP10 cells was serially diluted and the OD600 reading was taken for each. (UV/Vis Spectrophotometer zeroed using LB.) | *An LB culture of TOP10 cells was serially diluted and the OD600 reading was taken for each. (UV/Vis Spectrophotometer zeroed using LB.) | ||
Revision as of 17:45, 29 October 2008
 "
"
