PHA Project Modeling
From 2008.igem.org
| HOME | Team | Project 1 | Project 2 | Parts | Modelling | Notebook | Doodle Board |
|---|
PHA Project Modeling
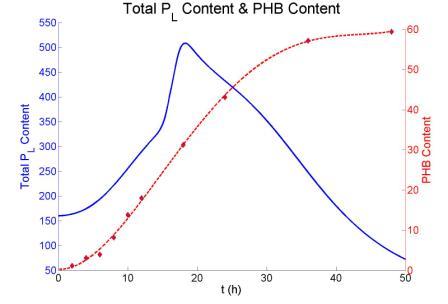
We Simulated the whole process from PHB synthesis to lysis gene expression.The results we've got are shown as following.
Expression of PhaR
Figure : the gaussian fit of phaR mRNA content. This curve is drawed according to the experiment data and also the fact that both the transcription of phaR and phaP is regulated by phaR protein.
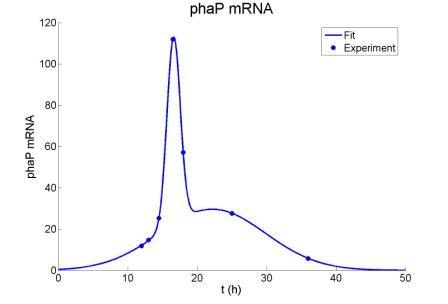
Figure : Gaussian fit of phaP mRNA curve. The scale of the vertical axis can’t be decided because the experiment can just tell us the relative amount of phaP mRNA amount. But we use the same scale for phaR mRNA content.
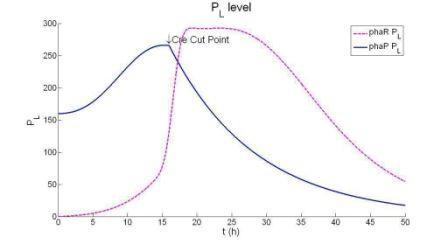
Figure :Free phaR Protein content and the rate for them to bind to PHB granules. Because phaR is continuesly binding to the pHB granules, so there are less free phaR. At the same time, phaP is increasing much faster since less phaP is used to inhibit its transcription. But when there are too much phaP, the phaR will be replaced by phaP on the surface of the granules. What we see in this graph is that the amount of free phaR protein go down first and go up again. The cohesion rate is positive first but becomes negative later.
| HOME | Team | Project 1 | Project 2 | Parts | Modelling | Notebook | Doodle Board |
|---|
 "
"


