Team:Imperial College/Biobricks
From 2008.igem.org
m |
m |
||
| (17 intermediate revisions not shown) | |||
| Line 1: | Line 1: | ||
{{Imperial/StartPage2}} | {{Imperial/StartPage2}} | ||
<br> | <br> | ||
| - | {{Imperial/Box2|Biobrick Characterisation in ''B.subtilis''| | + | {{Imperial/Box2|Biobrick Characterisation in ''B. subtilis''| |
| - | + | The testing constructs we developed for characterisation of one of our promoter-RBS combinations are shown below: | |
| + | [[Image:Biobricks Imperial.PNG|center|500px]] | ||
| + | }} | ||
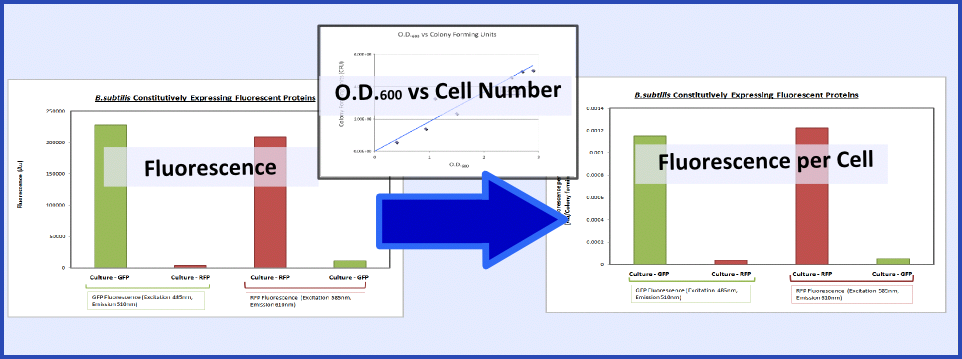
| - | + | {{Imperial/Box1|Summary of Data|The promoter and RBS combinations were characterised by measuring the expression of fluorescent proteins in ''B. subtilis''. Cultures of ''B. subtilis'' transformed with the test constructs and non-transformed ''B. subtilis'' (control) were grown to the mid-log phase. Fluorescence and O.D.<sub>600</sub> were both measured using a plate reader to generate fluorescence levels of the various samples. To make this data more generic, the fluorescence data were normalized to cell number using the O.D.<sub>600</sub> and a '''calibration curve of O.D.<sub>600</sub> vs colony forming units''', as explained in the diagram below: | |
| - | + | <br> | |
| - | + | [[Image:Calibration Picture.PNG|600px|center]] | |
| - | + | ||
| - | + | ||
| - | + | ||
| - | [[Image: | + | |
<br> | <br> | ||
| - | + | This calibration curve allowed us to produce the final data as shown below. The following graph clearly shows that ''B. subtilis'' transformed with GFP and RFP BioBricks are fluorescing at the corresponding excitation and emission wavelengths. | |
<br> | <br> | ||
| + | [[Image:Fluorescence B.subtilis.PNG|400px|center]] | ||
}} | }} | ||
| - | <hr> | + | <hr> |
| + | {{Imperial/EndPage|Major_Results|Major_Results}} | ||
Latest revision as of 02:29, 30 October 2008
|
|||||||||||
 "
"


