Calibration Curves
- The two measurements that will be made for the various devices are fluorescence emission and absorbance at 600nm.
- The aim of the characterisation is to use these two measurements in order to create a more generic unit to allow for modular design and easier repetition of experiments. The unit that has been chosen to be used is GFP molecules synthesized cfu -1 sec-1 .
- In order to convert our raw data into these units, two sets of calibration curves are needed.
- There are broadly two types of calibration curves that we will require,
- Absorbance (600nm) vs Colony Forming Units (CFU).
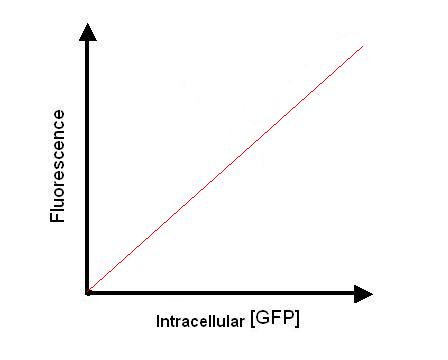
- Fluorescence vs intracellular GFP concentration.
Absorbance
- The Absorbance of the cultures in the wells are measured to allow to convert our absorbance raw data into a cell count, so that cell we can relate GFP synthesis per cell.
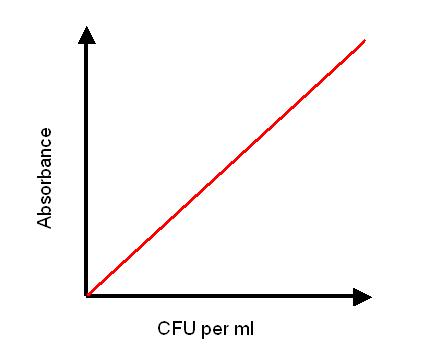 Example of Absorbance Calibration Curve - Cultures of the E.coli with the relevant vector are grown to various cell densities. A sample of these cultures are taken and a dilution plate is carried out to work out approximate colony forming units per ml of culture.
- These various cultures have their absorbance measured at 600nm to give an absorbance measurement for the various cell densities.
- This data set is then combined, creating a graph relating the number of colony forming cells per ml to their absorbance measurements.
- This curve then allows us to convert absorbance of a known volume of culture to colony forming units within the culture sample.
- The same strain will be used throughout the experiments with the various devices. This means that absorbance change is minimal between our devices and so we can apply the same calibration curve.
Fluorescence
Calibration Curve
 Example of Fluorescence Calibration Curve - In the protocols of the characterisation of the parts, the fluorescence of various wells in a fluorometer plate is measured. These wells correspond to varying conditions i.e. different levels of expression are induced. The fluoresence of these wells is recorded against time.
- In order to convert the raw data of fluorescence of each well at a specific time point into GFP molecules synthesized sec-1 we will make use of the Fluorescent Calibration Curve.
- In order to obtain this calibration curve (axes shown right) we need to conduct three experiments. These are described below:
Experiment 1
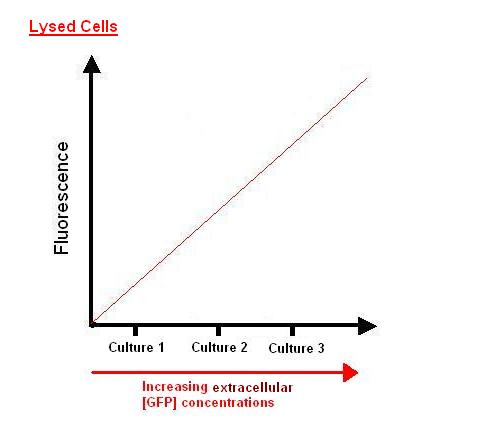
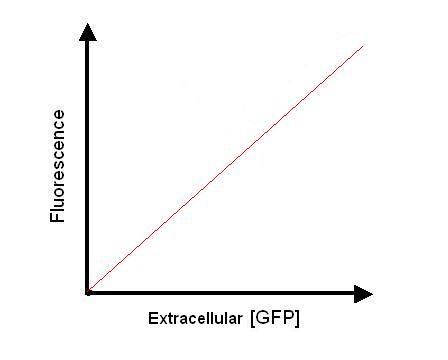 Fluorescence vs Extracellular [GFP] - The first stage of producing a calibration curve is to produce a graph of fluorescence vs extracellular [GFP] molecules.
- To do this a known concentration of GFP is diluted into a range of dilutions. The dilutions are carried out in cell lysis of the wild type of the host cells used, e.g. if K12 used as expression cell, then a lystae of K12 cells are used. The reason for this is that the quantum efficieny(ration between absorption of photon to emission of photon) of the GFP may change in the solution of the cell.
- With these dilutions we can then measure the amount of fluorescence for various [GFP] in extracellular conditions.
- This allows us to plot the graph on the right.
Experiment 2
 Fluorescence vs Cultures of varying unknown intracellular [GFP] - From experiment 1 we get fluorescence related to extracellular [GFP], however, with our protocol we are concerned with measuring the intracellular [GFP]. This is because we want to measure fluorescence at various time points for a particular culture of cells, and so by measuring intracellular [GFP] rather than extracellular [GFP] cells do not have to be lysed and so the same culture can be measured at various times.
- The first stage in measuring the intracellular [GFP] is to make cultures that have a range of unknown [GFP] intracellular concentrations.
- To do this we take several cultures of cells and expose them to a relevant inducer to induce expression of GFP. However, we stop the reaction at various times so that in the end we have a range of cultures with a range of unknown intracellular [GFP].
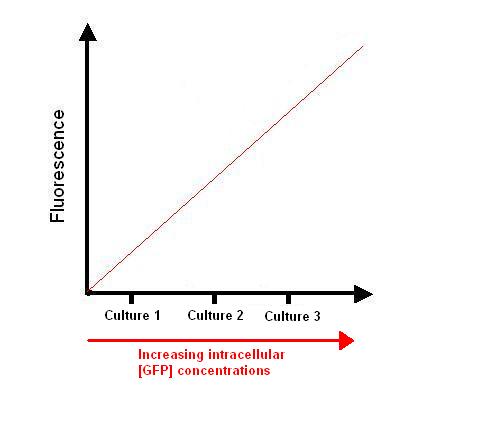
- For each culture the fluorescence is measured to create a graph of Fluorescence vs Cultures of varying unknown intracellular [GFP].
- To the right is an example of what an experiment would look like if 3 cultures were used.
Experiment 3
 Fluorescence vs Cultures of varying unknown extracellular [GFP] - The purpose of this experiment is to relate the intracellular florescence of experiment 2 to a known intracellular [GFP].
- To do this we need to relate experiment 1 to experiment 2. This means relating the fluorescence of unknown intracellular [GFP] of various cultures(exp2) to the fluorescence of known extraceullar [GFP](exp.1)
- To do this the the cultures from experiment 2 are lysed and the fluorescence measured. This fluorescence will represent the fluorescence of unknown extracellular [GFP].
- This fluorescence can be related to known [GFP] molecules from experiment 1, by comparison of the fluorescence levels.
- With the extracellular [GFP] molecules in the culture known, we can assume that the intracellular [GFP] across the population of the cells is the same. We can then plot a graph of the known intracellular [GFP] vs fluorescence, this is the Calibration Curve shown above. This will then mean that if we have a fluorescence measurement we can estimate the intracellular [GFP].
|
 "
"


