Team:KULeuven/Model/Filter
From 2008.igem.org
(→Parameters) |
(→Parameters) |
||
| Line 66: | Line 66: | ||
| K<sub>eq_1</sub> | | K<sub>eq_1</sub> | ||
| 0,015 [M] | | 0,015 [M] | ||
| - | | closed and open mRNA, | + | | between closed and open T7 mRNA, experimental |
| [http://parts2.mit.edu/wiki/index.php/Berkeley2006-RiboregulatorsMain link] | | [http://parts2.mit.edu/wiki/index.php/Berkeley2006-RiboregulatorsMain link] | ||
|- | |- | ||
| K<sub>eq_2</sub> | | K<sub>eq_2</sub> | ||
| 0.0212 [M] | | 0.0212 [M] | ||
| - | | closed and key unlocked mRNA complex, | + | | between closed T7 mRNA and key unlocked mRNA complex, experimental |
| [http://parts2.mit.edu/wiki/index.php/Berkeley2006-RiboregulatorsMain link] | | [http://parts2.mit.edu/wiki/index.php/Berkeley2006-RiboregulatorsMain link] | ||
|- | |- | ||
Revision as of 14:03, 27 August 2008
Contents |
Filter
Position in the system
The filter is positioned immediately after the input, because its job is to filter out possible noise signals or background signals that aren't caused by the "desease". It is the starting piece of the whole system, situated before the invertimer- and the reset-subsystem.
Describing the system
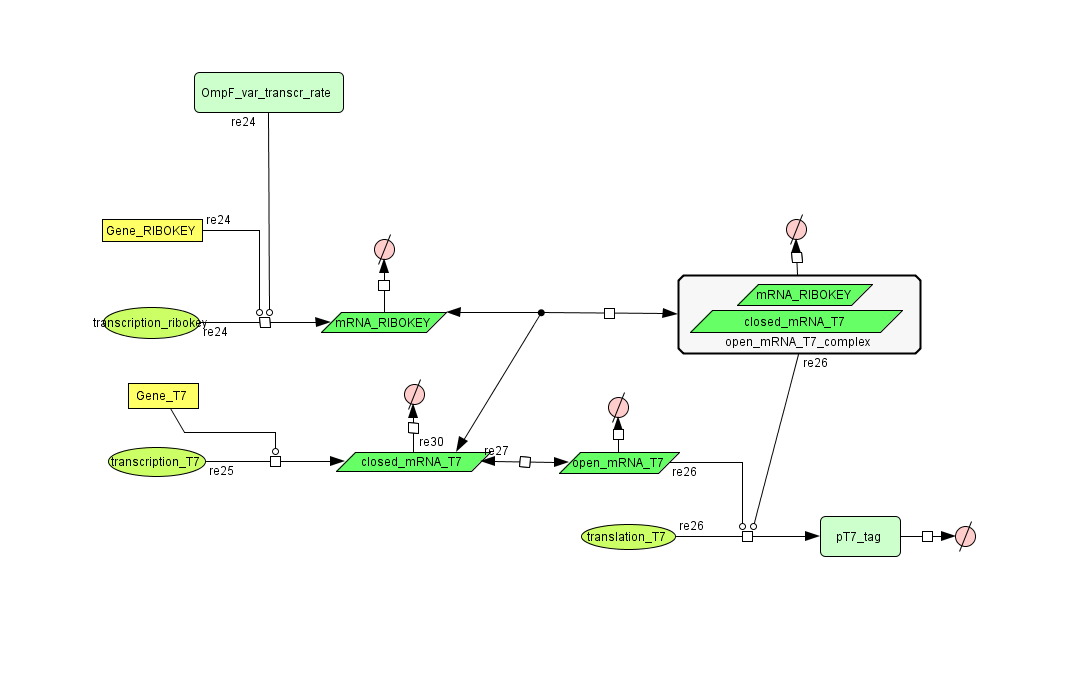
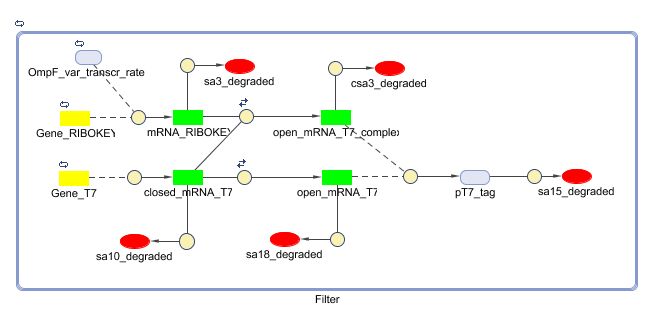
see also: Project:Filter
ODE's
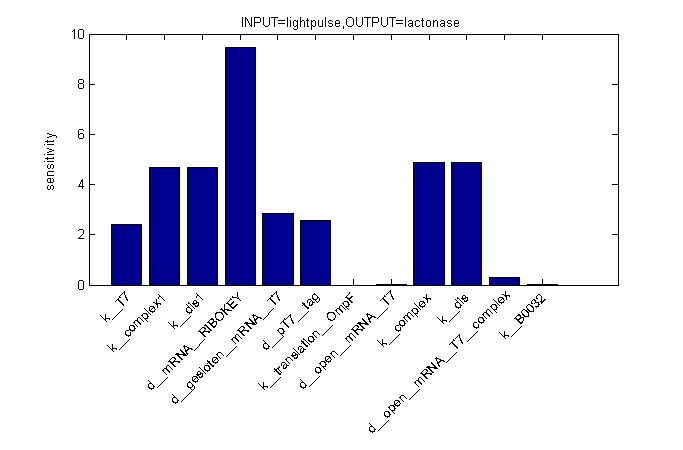
Parameters
| Name | Value | Comments | Reference |
|---|---|---|---|
| Degradation rates | |||
| dpT7_tag | 0.00155 s-1 | UmuD tag added to speed up degradation of otherwise too stable T7 polymerase | link |
| dmRNA_RIBOKEY | 0.00462 s-1 | link | |
| dclosed_mRNA_T7 | 0.00462 s-1 | link | |
| dopen_mRNA_T7 | 0.00231 s-1 | link | |
| dopen_mRNA_T7_complex | 0.00231 s-1 | link | |
| Equilibrium constants | |||
| Keq_1 | 0,015 [M] | between closed and open T7 mRNA, experimental | link |
| Keq_2 | 0.0212 [M] | between closed T7 mRNA and key unlocked mRNA complex, experimental | link |
| Rate constants | |||
| kdis | 100 s-1 | derived from experimental values | |
| kcomplex | 57 s-1 | derived from experimental values | |
| Transcription rates | |||
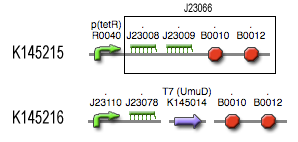
| TetR_var_transcr_rate | p(TetR) dependent | (RiboKey) between 5E-5 and 0.0125 s-1 ~ [aTc] | |
| kmRNA_T7 | 0,0011 s-1 | ||
Remark: The key-lock system has been enhanced to 0.3%-14% (todo: new parameters will be added in a new overview)
Models
CellDesigner (SBML file)
Matlab (SBML file)
Simulations
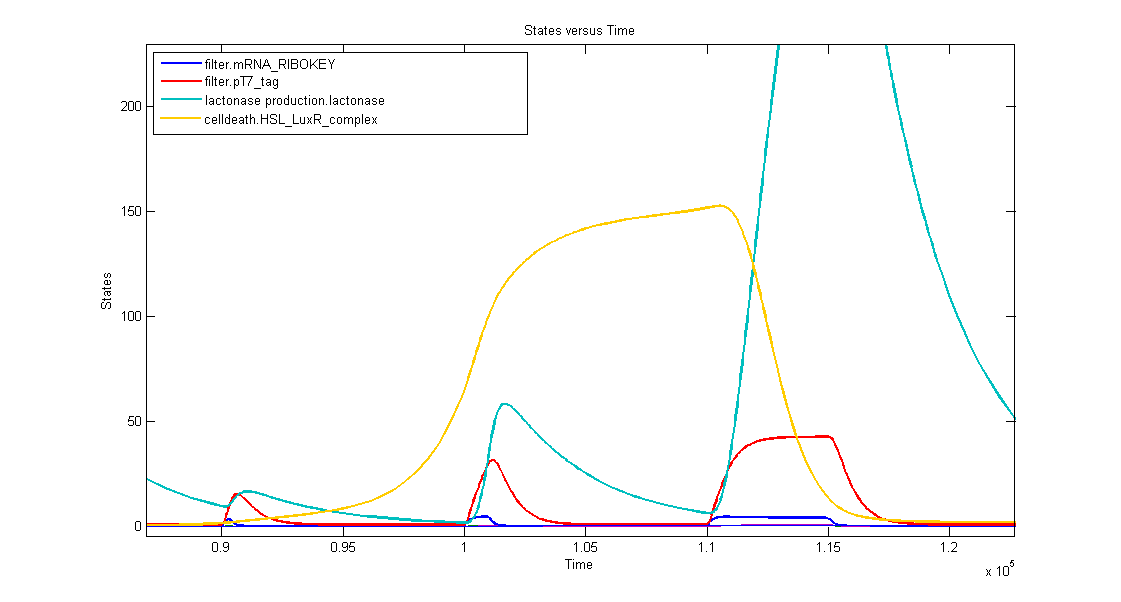
1. AND gate of the filter
In the simulation we can clearly see this series of events:
- when dark blue(ribokey) starts to increase, red (T7) also starts to increase, giving rise to an increasing amount of lactonase (blue) = AND-GATE.
- when dark blue(ribokey) starts to decrease, red (T7) also starts to decrease, but much slower. The lactonase also starts to decrease, as it should be.
The short lifetime of the ribokey compared to the lifetime of the T7-protein, guarantees that the AND-GATE always works perfectly fine: when there's no more input, the ribokey will rapidly decrease (and disappear) and makes sure that the AND-GATE is not activated anymore, even when the T7-protein is slowly decreasing.
2. Filtering in practice
In the simulation three kinds of inputpulses have been used:
- First pulse: 300s
- small peak of lactonase
- no influence on the timer
- Second pulse: 1000s
- medium peak of lactonase
- influences the timer by levelling the timing capabilities, but it doesn't reset the timer
- Third pulse: 5000s
- huge peak of lactonase
- reset of the timer: amount of complex goes to zero
 "
"


