Team:NTU-Singapore/Parts/Characterization of pLsrA-YFP
From 2008.igem.org
Lalala8585 (Talk | contribs) (→Procedure) |
(→Characterization of plsrA-YFP) |
||
| Line 8: | Line 8: | ||
| - | = | + | ='''Characterization of plsrA-YFP'''= |
| - | + | ==Procedure== | |
1) The successfully ligated plasmid with pLsrA-YFP gene was first transformed into chemically competent LuxS(-) cells. <br><br> | 1) The successfully ligated plasmid with pLsrA-YFP gene was first transformed into chemically competent LuxS(-) cells. <br><br> | ||
2) The next day, one colony of cell with pLsrA-YFP plasmid was inoculated in 5ml LBA for 16 hours at 37oC and shaked at 225 rpm.<br><br> | 2) The next day, one colony of cell with pLsrA-YFP plasmid was inoculated in 5ml LBA for 16 hours at 37oC and shaked at 225 rpm.<br><br> | ||
Revision as of 08:11, 26 October 2008
|
Characterization of plsrA-YFP
Procedure
1) The successfully ligated plasmid with pLsrA-YFP gene was first transformed into chemically competent LuxS(-) cells.
2) The next day, one colony of cell with pLsrA-YFP plasmid was inoculated in 5ml LBA for 16 hours at 37oC and shaked at 225 rpm.
3) Overnight cell culture was then centrifuged at 4000 rpm and 4oC for 10 minutes.
4) The supernatant was discarded and cell pellets were re-suspended in 5ml of Ampicilin-containing M9 medium. The amount of M9 medium was adjusted until cell suspension had an OD600 of 1.
5) The cell suspensions were then pipetted into 96-well microplate wells. This was followed by the adding of 50µl AI-2-containing supernatant into corresponding wells.
6) There were 6 different supernatant solutions used, which correspond to the time points when they were obtained: 2, 3, 4, 5, 6, 8 hours.
7) There were 3 different negative control samples being used for this study.
  * The First control sample contained cell suspension only.

  * The Second control sample was cell suspension with 50µl pure water added.

  * And as the supernatants also contain large amount of LB, cell suspension with 50µl

    LB added was also used as another control sample.
8) YFP measurement was carried out by VICTOR 3 multilabel reader at excitation wavelength of 490 nm and emission wavelength of 535 nm.
9) Data were automatically gathered every 10 minutes and temperature was set at 37oC.
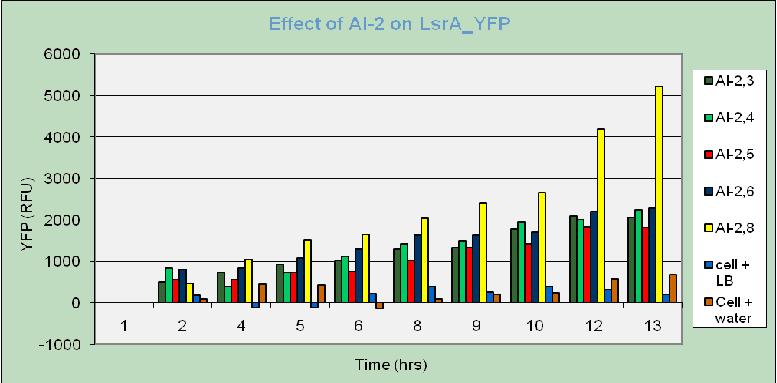
For all the samples with AI-2 added, relative fluorescence unit (RFU) increases with time. In contrast, the cell samples with 50 µl water added have their RFU low and not varied much. The control samples with addition of 50 µl of LB have higher RFU level, yet it remained steady with time. From this observation, it can be concluded that the increase in RFU of the samples with AI-2 addition is not related to cell growth as as result of LB presence in the supernatants. Hence, this increasing trend can be well explained as YFP was actually expressed in the presence of AI-2. This further proves that the LsrA promoter part BBa_K117002 in fact works correctly as it is activated in the presence of AI-2. Further characterization of this promoter will be implemented in future works. From this result, it is highly expected that the detection system part BBa_K117010 also expresses lysis protein (celE7) upon induced by AI-2.
This clustered column graph shows a clearer view on RFU expressed by different samples throughout the experiment. As expected, RFU levels of the control samples (cell suspension with addition of water and LB) are very low and not varied much compared to the high and increasing RFU of the samples with AI-2-containing supernatants.
Another conclusion can be drawn is that AI-2 activity seems to be highest for the supernatants obtained after 8 hours of incubation. "
"


