 "
"
Team:TUDelft/Temperature analysis
From 2008.igem.org
Contents |
Analysis
Cells are constantly subjected to changing environmental conditions and one example of such a changing environmental condition is temperature. A mechanism found in different organisms, that makes the cell respond to thermal changes, is the RNA thermometer. For the input of our system we are going to use this switching mechanism to let the cell produce a color at a certain temperature.
This page provides an overview of what has been learned during the analysis, which has been performed to get more insight into the functioning of RNA thermometers. Sections RNA switch and RNA thermometer provide the working principle of RNA switches and, more specific, RNA thermometers. The following sections provide a more detailed view on the working of the RNA thermometer. A short introduction to secondary structure and free energy is provided first, which is then used to explain about the stability of the RNA thermometer's secondary structure. Finally, the result of a data analysis on the stability of the RNA thermometer's structure is given, which will be used in the second design phase for the design of RNA thermometers with a different switching temperature.
RNA switch
A way to respond to environmental changes is through transcriptional regulation. This, most well known regulation system, acts at the DNA level in which proteins or protein complexes regulate the transcription of certain genes by binding to the DNA (figure 1).
Recently a number of post-transcriptional regulatory systems, that work at the RNA level, have been discovered. These systems, which are called RNA switches, regulate the translation instead of the transcription. They all work in a similar way. In a certain state the RNA is folded in such a way that the Shine Dalgarno region (ribosome binding site) is occluded, preventing the ribosome to bind to the RNA and thereby preventing the initiation of the translation. In this case you could say that the switch is in the off-state, which means that the translation of the gene encoded by the RNA stretch is switched off. An external factor can cause a state transition from the off to the on state. This happens through a conformational change of the RNA caused by an external factor. After the conformational change the Shine Dalgarno region is exposed, enabling the ribosome to bind to the RNA and thereby enabling the initiation of the translation of the protein encoded by the RNA (figure 2).
RNA thermometer
There are different kinds of RNA switches, having different external factors that switch on the system. For example RNA switches that are switched on by small ligands are called riboswitches and those that are switched on by short trans-RNA stretches are called trans-acting RNA switches. The ones we are interested in are the RNA thermometers, which reside at the 5' end of an mRNA, and respond to a change in temperature.
At a certain temperature, e.g. 30°C, the 5' non-coding mRNA region folds into a hairpin structure that blocks translation by occluding the Shine Dalgarno region. With a rise in temperature, the binding forces between the base pairing nucleotides, which form the hairpin structure, decrease. Above a certain threshold temperature, the base-pairing nucleotides lose their binding, causing the hairpin structure to (partially) unfold and the Shine Dalgarno region to become exposed. This way a rise in temperature can cause the initiation of translation.
RNA thermometer families
When we look at known RNA thermometers (the research area is relatively young and it is expected that more are to be found) they can be split up into different families based on their secondary structure. Two of these families: Rose and PrfA, as specified by the Rfam database, are found in prokaryotes, and thus of interest to us. A third family has been found in literature and is proposed to be called the FourU family [1] .
Requirements for an RNA thermometer
It appears that not much is needed to have a functioning RNA thermometer. It has been shown that no accessory factors, such as ligands or proteins, are needed for the temperature sensing [2].
When looking at the ROSE structure it has also been shown that the extra hairpins, all but the temperature sensitive one, are not required for the temperature sensing [3]. The only requirement for a functioning RNA thermometer is that the secondary structure of the RNA forms a hairpin structure which includes the Shine Dalgarno region.
De Smit and Van Duin [4] have shown that there is a strict correlation between the translation efficiency of an mRNA and the stability of the double helix region of the hairpin structure (figure 4) that contains the Shine Dalgarno sequence. This shows that the switching temperature can be shifted by altering the stability of this double helix region. Making the double helix less stable would cause the helix to melt at a lower temperature. In this case the translation will be initiated at a lower temperature, which also means that the switching temperature is shifted to a lower temperature. Shifting the switching temperature upwards can be achieved by making a more stable double helix. The stability of the double helix is determined by the free energy, before looking into more detail at that stability, the concept free energy will be introduced first.
RNA secondary structure and free energy


The primary structure of an RNA molecule is its sequence of ribonucleic acids. Due to base-pair interactions and interactions with the environment, this strand of ribonucleic acids folds into a secondary structure. These secondary structures can be divided into elementary building blocks (structural motifs), such as double helices, hairpin loops, bulge loops, and internal loops (figure 3). Interactions between these structural motifs cause the RNA molecule to fold into a three-dimensional tertiary structure [5].
The part of the RNA molecule that is temperature sensitive folds into a secondary structure which is called a hairpin. This structure consists of a double helix region with at the end a hairpin loop (figure 4). Bulges, mismatch pairs, and internal loops can reside within the double helix, destabilizing the hairpin structure.
Free energy
Base pairing interactions within the RNA molecule and interactions of the RNA molecule with it surroundings causes changes in the free energy (kcal/mol) of the structure. This free energy gives a measurement of the proportion of enthalpy (energy) and entropy (disorder) within the system. Chemical systems tend to minimize this free energy, thereby maximizing the stability of the structure, because the lower the free energy, the more stable the structure will be [5]. A method to predict the secondary structure of an RNA molecule is to search for the structure with the lowest free energy.
RNA secondary structure prediction tools

RNAfold, which is part of the Vienna RNA package, and mfold are two software tools that use the same algorithm, based on the minimization of the free energy, to predict the secondary structure of an RNA molecule [6][7]. It has been shown that this algorithm provides an accurate prediction of secondary structure for short stretches of RNA. Since RNA thermometer sequences are relatively short (around 100 nucleotides), RNAfold has been used for the prediction of their secondary structure. A short explanation of the folding algorithm can be found in Eddy 2004 [8].
As mentioned in the beginning of this section, an RNA secondary structure can be split into a number of structural motifs. RNAfold calculates the free energy of an RNA secondary structure by adding the free energies of all of its structural motifs (figure 5). The free energies of these structural motifs are optimized using experimental data [9].
RNAeval, which is also part of the Vienna RNA package, has been used to get more detailed information about the distribution of the free energy within the structure. What this program provides is a list of the free energies of all structural motifs. In case of figure 5, all the free energies at the top are returned, together with extra information about the kind of structural element and its location within the structure.
Stability of an RNA hairpin
As mentioned in the previous section, the stability of a hairpin is determined by the free energy of the structure. The lower the free energy, the higher the stability, and the higher (the more close to zero) the free energy, the lower the stability.
Papers that compare the translation efficiency to the stability of the secondary structure only look at the total free energy of the hairpin structure [4][10]. This total free energy is the sum of the free energies of all the structural motifs within the structure (figure 5). But as one could imagine, two hairpin structures can have the same total free energy, but a different distribution of these energies, which could be of importance to the working of the RNA thermometer.
When, for example, a hairpin structures has some very strong base pairs (e.g. two adjacent g-c base pairs) within the Shine Dalgarno region, this could mean that the SD region of the hairpin is to stable to have it melt at a reasonable temperature. The hairpin will then not function as an RNA thermometer. But when we would have a hairpin with the same total free energy, but the strong base pairs at some distance from the SD region, it could be that the SD region does melt at a reasonable temperature. In this case, the hairpin, although it has the same free energy, does work as an RNA thermometer.
In order to get a more detailed view on the stability of the temperature sensitive hairpin, a data analysis on a number of known RNA thermometers has been performed.
Data analysis
The data analysis has been performed in order to find similarities between the free energy distributions of different RNA thermometers from the ROSE family. Finding a similar distribution of these free energies could help us in the design of an artificial RNA thermometer, in that it could serve as a design template.
The reason that the ROSE family has been chosen instead of the FourU family is that there are more ROSE than FourU sequences available which can be used for the data analysis. The reason that a sequence of the ROSE family has been chosen instead of one of the PrfA family is that there are more papers about the working and effects of mutation on ROSE RNA thermometers than on PrfA RNA thermometers.
Method

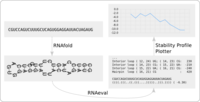
The analysis has been performed on 32 ROSE RNA thermometers retrieved from the Rfam database. From the 32 ROSE RNA thermometers, the sub-sequences that forms the temperature sensitive hairpins are provided to RNAfold to predict their secondary structures. RNAeval has been used to determine the free energies within the temperature sensitive hairpins and finally the Stability Profile Plotter has been used to plot the distribution of the free energies within the structure (figure 6).
How to plot the free energy distribution
The plot at the right top of figure 6 visualizes the free energies within a hairpin structure. The free energy in kcal/mol is given at the y-axis and the x-axis is the position within the hairpin structure (with the hairpin loop at the left side).
There are different ways in which we can plot the free energies. Firstly, two different ways of alignment to the secondary structure can be used. RNAeval provides one free energy value per structural motif. If we plot these values with the same distance on the x-axis, each step on the x-axis compares to one structural motif. Another approach would be to take one step on the x-axis for each foursome of nucleotides. In this case, an internal loop would span more than one step. The first approach will be called non-aligned and the second aligned.
Secondly, the free energies of the different structural motifs can be added up or not. In other words, stacking of the free energies can be applied or not. Stacking of the energies show how the free energy is build up within the structure while the non-stacked version could show characteristic free energies at a certain location within the structure. The first approach will be called stacked and the second non-stacked.
The third and last option would be if the free energy of the hairpin loop, is included or not. This option is only of interest to the stacked energy plot, because there it is of influence to the rest of the plot (different hairpin loops, with different free energies will cause the plot to start at a different height). When the hairpin loop is taken into account, this will be called the loop included approach, otherwise it will be called the loop excluded approach.
Results


Using all combinations of the given plot options provides six different plots for the 32 given temperature sensitive hairpins (figure 7).
The non-stacked versions (the two at the top) provide little information. The only thing that can be seen is that the locations of the bulge and internal loops (the peeks) within the hairpin structure do not seem to be highly conserved.
For the stacked versions with the hairpin loop included (the two in the middle), it can be seen that there are a lot of parallel lines that are spread because of the initial free energy of the hairpin loop (the leftmost free energy within the plot). This free energy of the hairpin loop therefore seems to have no influence on the working of the RNA thermometer. Note that this counts only for hairpin loops of the same size, it does not say anything about hairpin loops of different sizes.
For the versions with the loop excluded (the two at the bottom), the non-aligned version seems to be a better option compared to the aligned version. This plot shows a trend that seems to be characteristic for the stability off all the 32 RNA thermometers (figure 8). This trend line will be the basis for the design of the artificial RNA thermometers, which is described in the second design phase.
From now on the standard way to plot the distribution of free energies within a hairpin structure will be the stacked, non-aligned version, with the hairpin excluded (figure 8). This plot can be seen as a visualization of the stability of a hairpin structure and will therefore be called the hairpin's stability profile from now on.
Conclusions
As a conclusion of the data analysis we make two statements that will be used for the design of the artificial RNA thermometers.
Firstly, based on the non-stacked plots, we conclude that the locations of bulge and internal loops within the overall hairpin structure do not have an influence to the functioning of the RNA thermometer. So when designing an artificial temperature sensitive hairpin, these structural motifs can be placed anywhere within the double helix region in order to destabilize it.
Secondly, based on the found stability profile trend, we conclude that an artificial RNA thermometer with a similar overall structure should show a stability profile similar to the trend. This should hold when the RNA thermometer is almost fully switched on, because this is the case for the ROSE RNA thermometer at 37°C, the temperature which has been used for the calculation of the stability profile.
References
- ^ Torsten Waldminghaus, Nadja Heidrich, Sabine Brantl, and Franz Narberhaus. FourU: a novel type of RNA thermometer in Salmonella. Molecular Microbiology, 65(2):413-424, 2007. PMID:17630972
- ^ Saheli Chowdhury, Christophe Maris, Frédéric H-T Allain, and Franz Narberhaus. Molecular basis for temperature sensing by an RNA thermometer. The EMBO Journal, 25:2487–2497, 2006. PMID:16710302
- ^ Saheli Chowdhury, Curdin Ragaz, Emma Kreuger, and Franz Narberhaus. Temperature-controlled Structural Alterations of an RNA Thermometer. The Journal of Biological Chemistry, 278(48):47915-47921, 2003. PMID:12963744
- ^ Maarten H. de Smit and J. van Duin. Secondary structure of the ribosome binding site determines translational efficiency: a quantitative analysis. PNAS, 87(19):7668-7672, 1990. PMID:2217199
- ^ J. Nowakowski and I. Tinico. RNA Structure and Stability. Seminars in Virology, 8(33):153-165, 1997.
- ^ Ivo L. Hofacker. Vienna RNA secondary structure server. Nucleic Acids Research, 31(13):3429-3431, 2003. PMID:12824340
- ^ M. Zuker. Mfold web server for nucleic acid folding and hybridization prediction. Nucleic Acids Research, 31(13):3406-3415, 2003. PMID:12824337
- ^ S. Eddy. How do RNA folding algorithms work. Nature Biotechnology, 22(11):1457-1458, 2004. PMID:15529172
- ^ D.H. Mathews and J. Sabina and M. Zuker and D.H. Turner. Expanded Sequence Dependence of Thermodynamic Parameters Improves Prediction of RNA Secondary Structure. Journal of Molecular Biology, 288(5):911-940, 1999. PMID:10329189
- ^ Juliane Neupert and Daniel Karcher and Ralph Bock. Design of simple synthetic RNA thermometers for temperature-controlled gene expression in Escherichia coli. Nucleic Acids Research, 1-9, 2008. PMID:18753148