 "
"
File:Visualisation.png
From 2008.igem.org
No higher resolution available.
Visualisation.png (360 × 360 pixels, file size: 13 KB, MIME type: image/png)
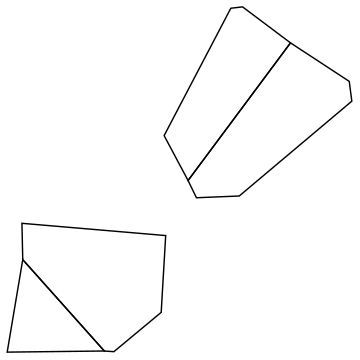
Voronoi diagram of the distribution of four cells in the Repressilator Netork.
File history
Click on a date/time to view the file as it appeared at that time.
| Date/Time | Thumbnail | Dimensions | User | Comment | |
|---|---|---|---|---|---|
| current | 17:41, 23 July 2008 | | 360×360 (13 KB) | Vincentqb (Talk | contribs) | (Voronoi diagram of the distribution of four cells in the Repressilator Netork.) |
File links
The following page links to this file: