Team:Freiburg/Modeling
From 2008.igem.org
| Line 192: | Line 192: | ||
<tr> | <tr> | ||
<td> | <td> | ||
| - | [[Image:Freiburg2008_M2ePath.png|thumb| | + | [[Image:Freiburg2008_M2ePath.png|thumb|400px|'''Figure 5: '''Pathway of receptor dimerization due to bivalent ligand]] |
</td> | </td> | ||
</tr> | </tr> | ||
</table> | </table> | ||
}} | }} | ||
Revision as of 14:22, 27 October 2008
|
Modeling |
_modeling
IntroductionThe dimerization of the extracellular receptor domains is a important necessity for the functionality of our modular receptor system. Presenting the system a stimulus in the form of spatial arranged ligands, the extracellular domains dimerize, thus the corresponding intracellular parts such as the split lactamase halves or split fluorescent proteins complement to measureable output. To analyse the theoretical functionality due to dimerization, first two receptor dimerization models (one T cell receptor model and one general receptor model) are introduced and discussed and then a proper model for the modular receptor system is constructed.
T cell receptor dimerization model I
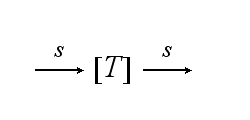
Extracellular signalingA simplified pathway shows the extracellular sequence of TCR activation. After the NIP binding two complexes come together and form a dimer which then leads to activaton of the TCR and further intracellular signaling and T cell activation.
Reaction kinetics
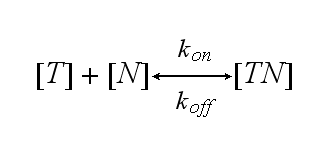
One NIP molecule (N) binds to a TCR (T) with the reaction rate kon or a TCR-NIP complex (TN) dissociates with the reaction rate koff :
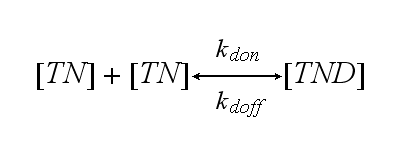
Two TCR-NIP (TN) complexes dimerize to a TCR-NIP dimer (TND) with rate kdon ; the dissociation of a TCR-NIP dimer runs with rate kdoff :
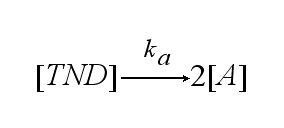
In order to get active TCRs, the TCR-NIP dimer (TND) has to switch into two active TCRs (A) with rate ka :
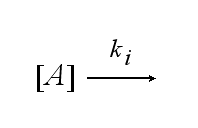
After activation, the TCR is internalised with rate ki and does not take part anymore in the extracellular signaling :
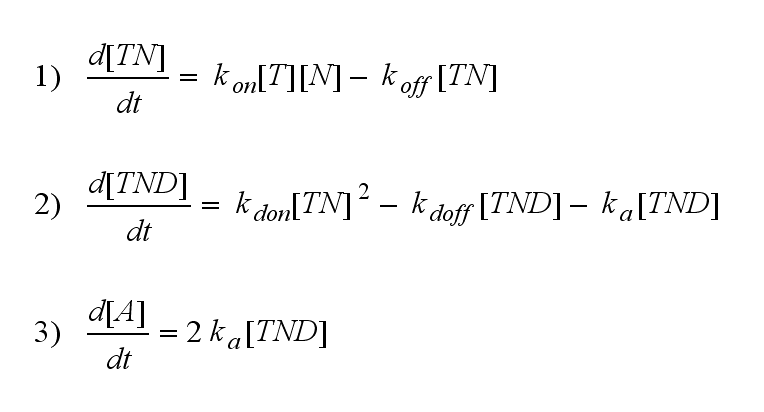
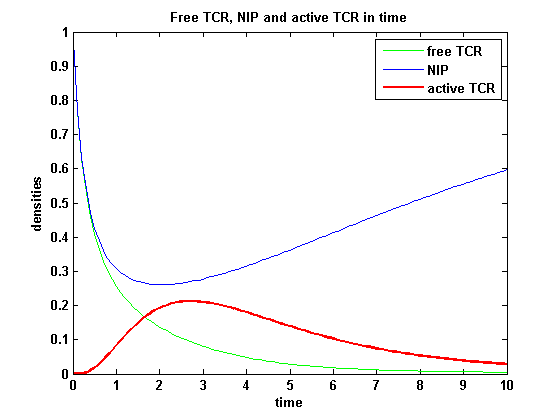
ODEs derived from the kinetics (Details)In the following equation T represents the free TCR in the T cell membrane where keff is a combination of kdon, kdoff and ka. kI is kon/koff : TCR activity for a set of parametersThe two ODEs above of this first basic model for a set of parameters are solved numerically. They reveal the timecourse of the TCR activity aswell as the one of the unbound TCR.
Extensions: Ultrasensivity and biphasic kineticsUltrasensitivityThe kinetics of the TCR activation can be generalised by substituting the second order kinetic of the ligand N and the receptor T by a parameter h, which then represents the kinetical order of the system. Biphasic kinetics and parameter analysisNot all TCRs on a T cell membrane can be recruited to NIP binding as a cell´s membrane contains several transmembrane proteins whose size can avoid a TCR-NIP formation when they surround a TCR and make the approaching of the NIP to the binding side of the TCR impossible. Considerating this spatial barriers leads to the idea of a TCR which can switch between two states, one binding state and one non-binding state. Hence a introduction of two different pools of TCRs into the model is appropriate. If a TCR is not available for a NIP molecule, thus it is in the non-binding state,it belongs to the so called spare pool, whereby TCRs belonging to the so called interface pool are in the binding state and can be accessed by the NIP molecule. Moreover the spare pool is in dynamical exchange with the interface pool, so non-binding TCR can become binding TCRs. This exchange is regulated through the parameter λ, a ratio between the spare and the interface pool and φ, the exchange rate constant. S is the spare pool TCR density and T the TCR density of the interface pool. A represents the active TCR density. So the full model I equations are: TCR activity dependent on exchange rate φ and ratio λ :
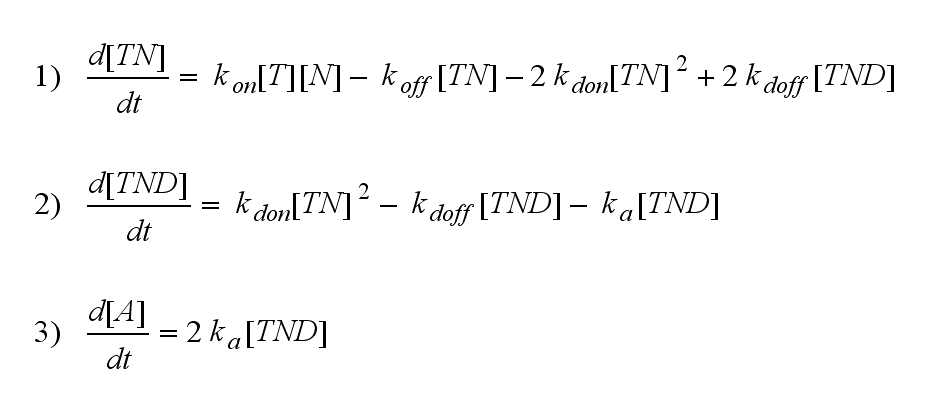
The x-axis represents the timecourse of the activity, the y-axis represents both parameters φ ( = y) and λ ( = 2 - y). So each black line in the plot is a timecourse of the TCR activity for a different φ and λ. The z-axis is the response intensity. With increasing exchange between the interface and spare pool, more TCRs switch to the binding state, hence more TCRs can bind NIP. As a consequence the active TCR density is higher then for a low exchange. Correctional termsRegarding the reaction kinetics and considering the ODEs as a model for TCR dimerization (Bachmann, 1999) led to the realization of an error in the mentioned publication. The ODEs evolved from the reaction kinetics are not :
but :
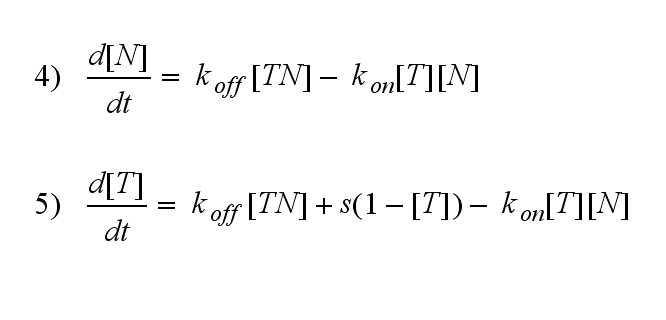
Furthermore can be derived for the NIP density and the free TCR:
After NIP addition the TCR activity rises to a maximum and decreases as active receptors are internalized and the NIP amount is used up. The free receptor density recovers due to permanent expression of new receptors which are build into the membrane.
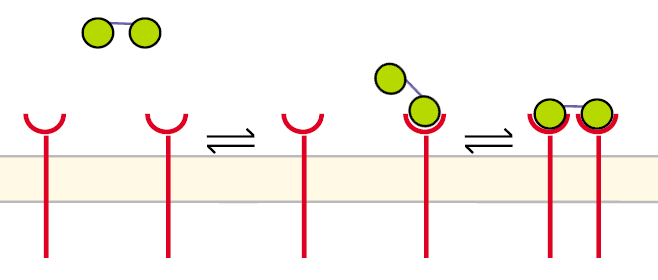
Receptor dimerization model IIA receptor dimerization can proceed in a different way aswell, especially when two NIP molecules are linked to a structure like our DNA-Origami: |
 "
"


