|
Mathematical analysis and simulations
FIFO
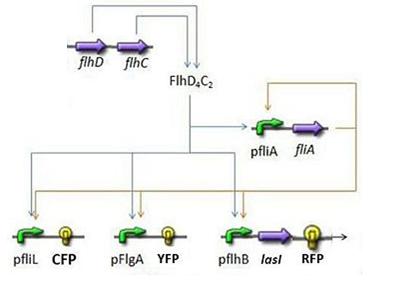
- In order to go further into the details of mathematical analysis of the FIFO, let us remind you the genetic network that has been designed to produce a First In - First Out behaviour and the result of the corresponding model :
Here is the set of equations used for the numerical simulations, with the parameters found in bibliographical studies (note that you can have an explanation on the way they have been built on the Model Construction page):
where CFP, YFP, and RFP will be denoted below as respectively Z1,Z2 and Z3.
We have implemented this system using Matlab (see the corresponding codes)
- Then, in order to obtain simulations of the expected FIFO behaviour, we set ideal conditions, by imposing flhDC as a step function, equal to one then to zero.
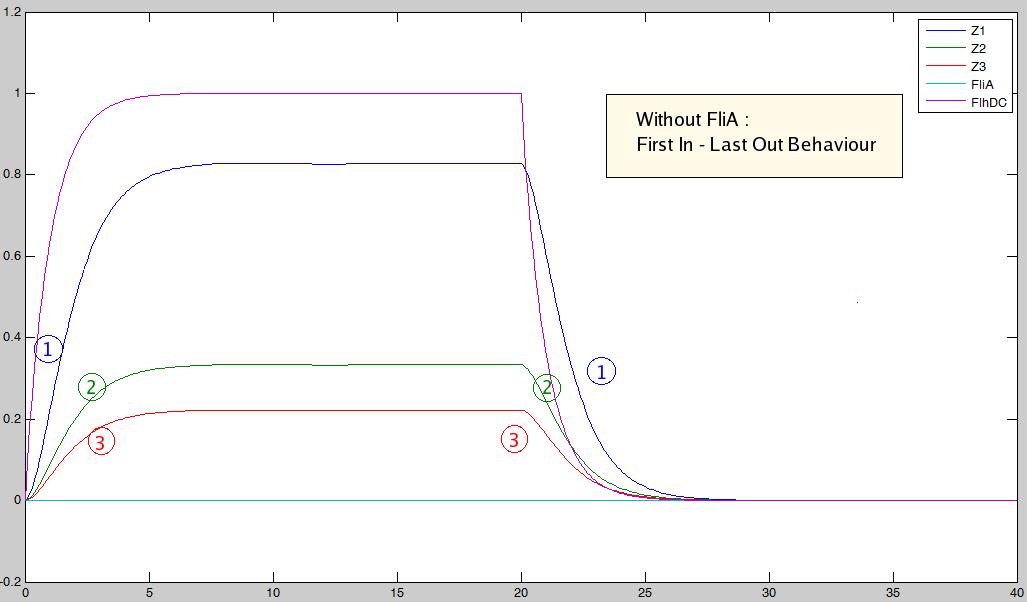
- We then simulated a first system, where [FliA] stays to zero value to confirm the qualitative conclusion that without FliA the FIFO would presumably not work :
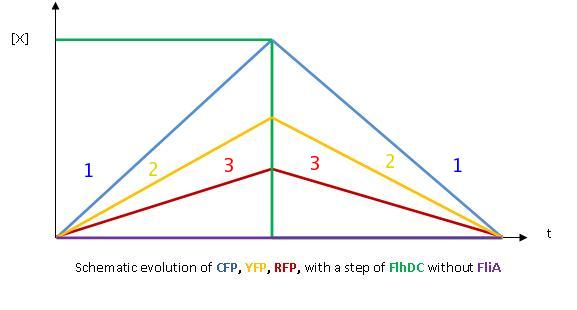
Indeed, we may see that there is a LIFO behavior rather than the FIFO we expect...
For a qualitative understanding of what is going on with and without FliA :
↓ Qualitative reasonning about the FIFO ↑
Which gene goes were?
- The key element to understand is that fliA stands as an accelerator. The first influence is caused by flhDC, and fliA gives the last burst. fliA also has a great influence in the fading phase, since it introduces a delay. This is what determined our choice in the order of fliL, flgA and flhB. We wanted to put in first the gene that was the least influenced by fliA, and in the end the gene the most influenced by fliA.
- In fact, this enabled us to force the curves into crossing themselves. In addition, the delay imposed by fliA in the decreasing phase, would permit us to widen the delays between the first and the last gene expression, thus getting better conditions to observe the FIFO in the wet lab.
|
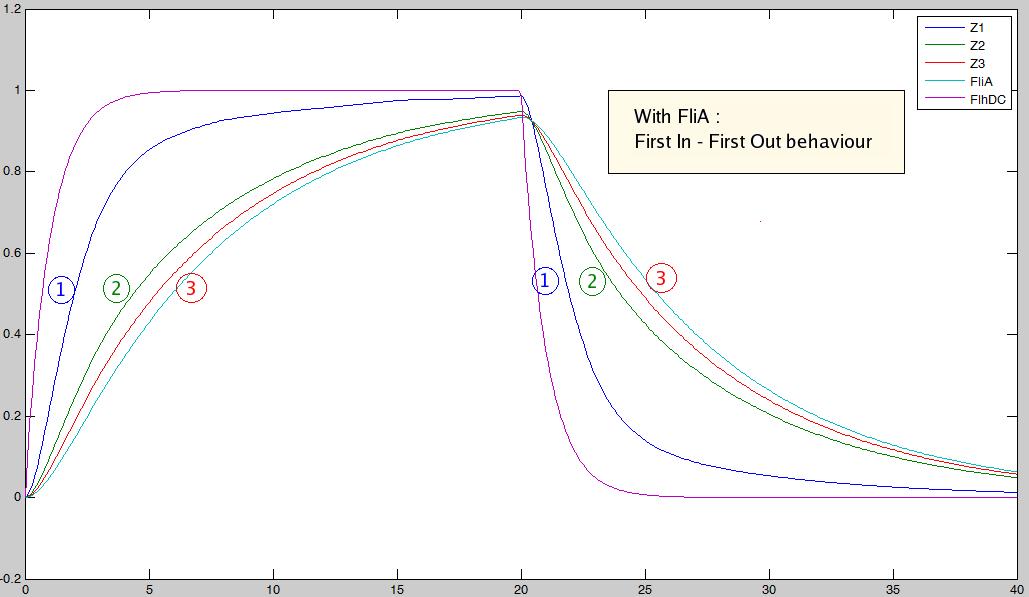
- The main differences that appear between the entire system (that means with FliA) and the sparse on (without FliA), are the following :
- the lasting burst due to FliA (more important for Z3 than for Z2, and more important for Z2 than Z1) in the increasing phase.
- the effect of fliA which maintained the concentrations to their maximum (more important for Z3 than for Z2, and more important for Z2 than Z1) in the decreasing phase. We have obtained the following curves, which are in perfect agreement with the theoretical definition of a 'FIFO' process as previously shown.
- FliA enables the curves to cross, and adds a delay on the genes that are most affected, with gives a better observability of the FIFO behavior.
Oscillations
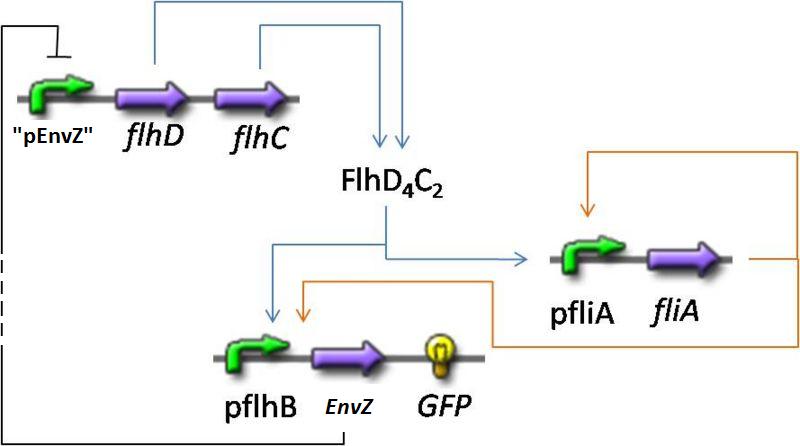
- In addition to the previous FIFO system, we will add a negative feedback on FlhDC promoter to observe oscillations. Thus, we obtained the following network and the corresponding equations (notice that we decide to model in a single arrowthe process through which that EnvZ repress FlhDC):
If you want more details about the way we have built them, you can go to the model construction page.
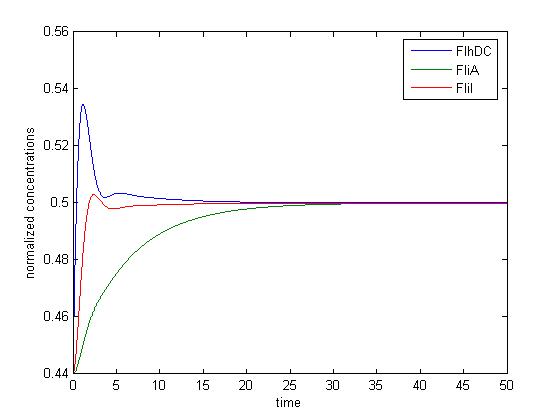
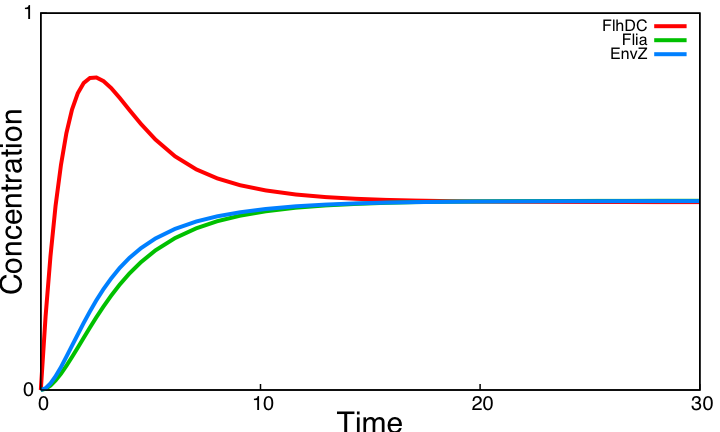
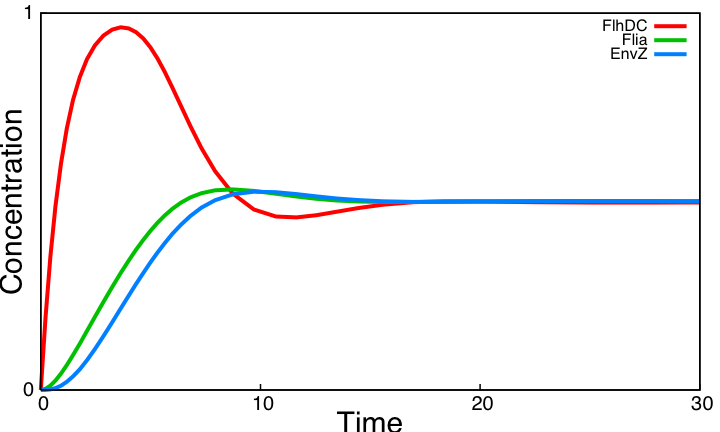
If one tries to draw simulations of this system, he will obtain this kind of results :
In a nutshell : It does not work !
Nonetheless, there are two questions we could focus on:
- Is it possible to prove theoretically that it will not produce oscillations ? For detailled answers :
↓ mathematical analysis ↑
Understanding the dynamics
The classical approach consists in finding the equilibrium state, by setting
Then, we evaluate the jacobian matrix, so as to put the system under its linearized form:
Where [EnvZ]* represents the equilibirum state of [EnvZ] and :
which gives :
Then, we want to find the eigenvalues of the jacobian matrix, because they make us understand the behavior of the system. Here is the theoretical explanation :
The λ and γ coefficients make the convergence. In our case they are negative terms, which explains the fact that we have a quick convergence for the system. Ideally, it could be convenient to find which parameter influence this coefficient, so as to play with it and be able to propose a better control of the convergence.
The μ coefficient is responsible for the oscillations. In fact, in another base, with only real matrix, this would beget cosinuses and sinuses terms. Furthermore, it is strongly linked to the period of the oscillations.
We can evaluate a value of the period we would have obtained without damping. Indeed, we have: With the parameters presented in the array before, we have evaluated the equilibrium values by solving
We obtained three solutions :
-0.2382 - 0.6139i
-0.2382 + 0.6139i
0.4764
We are only interested in positive real solutions. We can note that 0.4764 corresponds well to the experimental equilibrium value.
Then we evaluated the eigenvalues for the jacobian :
-1.0159 + 0.5042i
-1.0159 - 0.5042i
-0.1111
We can note that the λ and γ coefficient are negative, which corroborates the fact that we obtain a convergence.
Finally for since μ=0.5042 we find a theoretical period of Ttheoretical=12.4617.
- Understanding the attenuation
Furthermore, this theoretical study helps us understand that reducing the attenuation is tough. In fact, whatever the base in which you consider a matrix, the trace is conserved. Here, we obtain :
Since λ and γ are assumed (thanks to simulations) to be negative, we cannot avoid to have their sum to be (with absolute value) superior to 2. The only chance we have would be that the weight goes in the λ parameter because this parameter plays a role in the third dimension, in which we are not interested. However, for every simulation we made, we found the opposite. Trying to evaluate with non-numerical calculus does not provide relevant material.
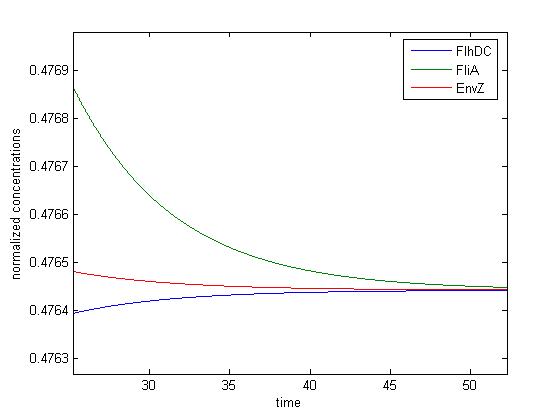
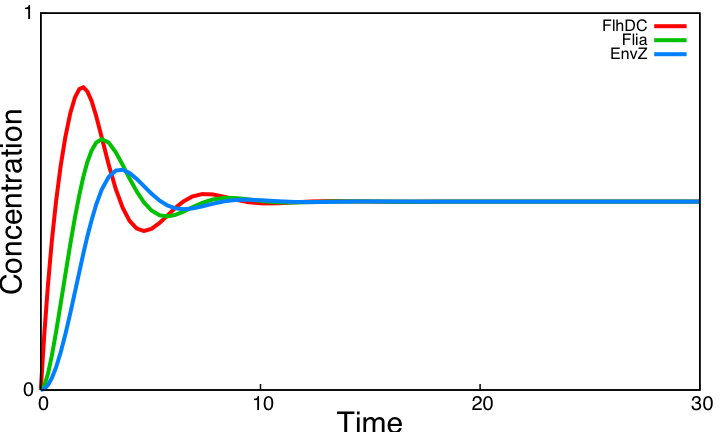
However, we now know that βFliA influences the attenuation. We ran a simulation with βFliA=0.02
This confirms what we saw previously. In this second case, the system is therefore less attenuated, and some very tiny damped oscillations can be observed.
Last but not least, one should not forget that we chose a normalized interpretation of the system. Thus, even though the attenuation phenomenon remains unchanged, the tiny oscillations we see may indeed be observable.
|
- Does this result depend on the integration methods used ? For more detailled considerations :
↓ Impact of integration methods ↑
Impact of simulation methods
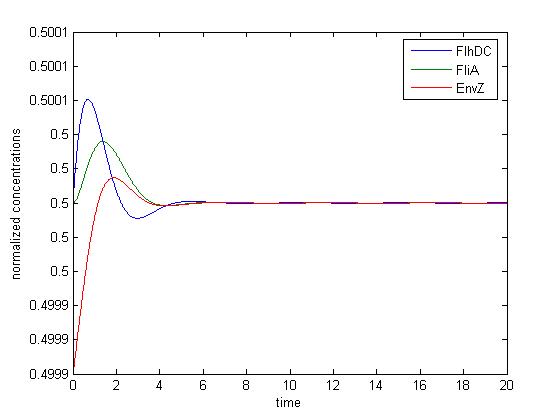
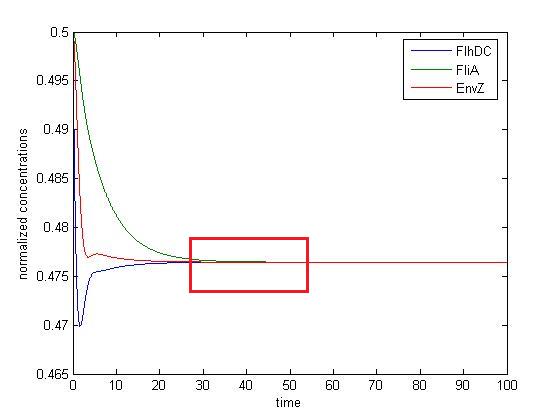
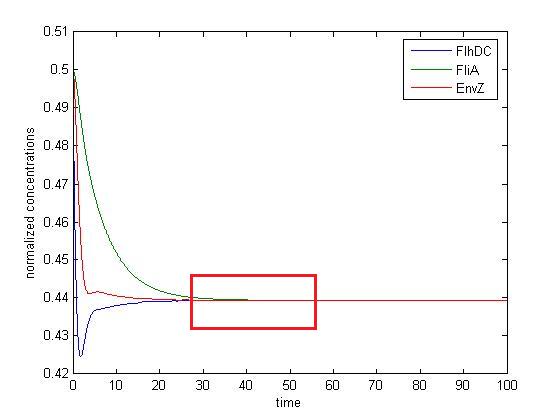
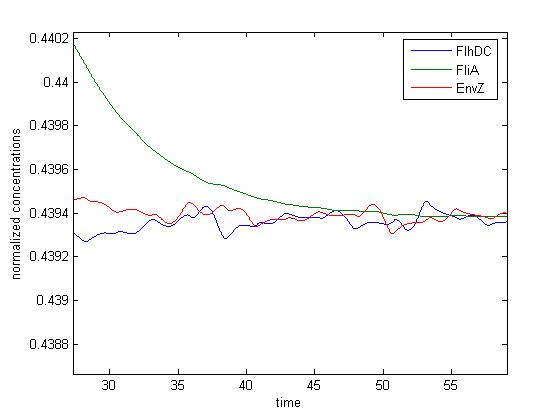
This section wil just be made of some simulations to show the influence of the solver used. Indeed, when it comes to detect oscillations, some weird phenomenon can just be produced by simulation algorithms' aterfact. We have just obtained the following curves for the same initial system of ODEs.
- Numerical simulations with Euler algorithm
(The second picture is just a zoom, as defined by the red box)
- Numerical simulations with variable-step methods
(The second picture is just a zoom, as defined by the red box)
One can notice that some oscillations seem to occur in the second case, which is not the case in simulations made with constant step. Therefore, the precise tuning of the algorithm used have to be undertaken in order to avoid false detection of oscillations.
|
Finally, the logical continuation of the process will be to try to improve the biological system in order to find oscillations. This will be described in the part below, as well as in the section System Improvements.
System analysis
Simulations of the core system displayed above reveal that it does not exhibit an oscillatory behavior. In this section we use the model of the core system to try to figure out the contribution of some key characteristics of the network topology on the dynamics of the system. This analysis is done by successively simulating altered forms of the system.
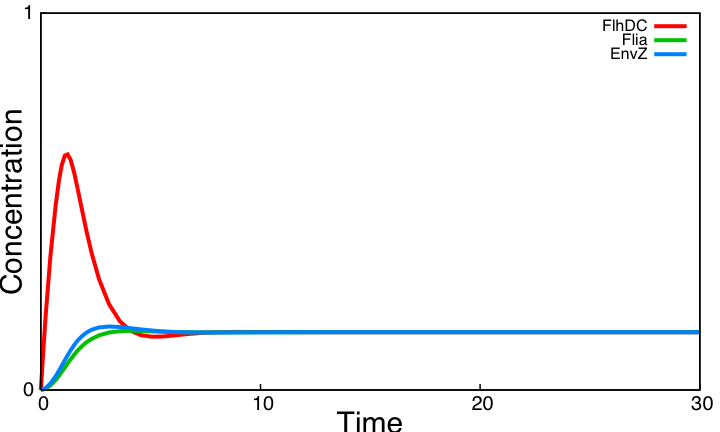
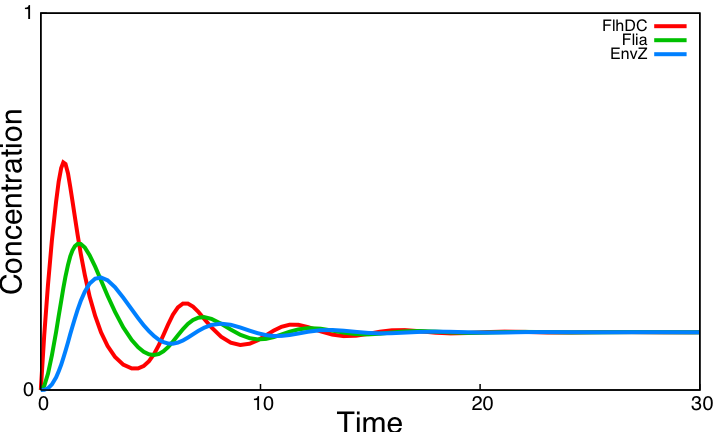
The following table lists the different forms of the system considered and their respective outcome :
| Description
| Simulation
| Evaluation
| Interpretation
|
| Core system (without modifications).
|
| 
| Non oscillating system.
|
| Removing the activation of envZ via FlhDC.
|
| 
| Non oscillating system. Activation of envZ via FlhDC has a negative effect on the presence of oscillations. This interaction creates a 'shortcut' in the negative loop, diminishing the delay between FlhDC and EnvZ. Notice that without this shortcut EnvZ increases after Flia. This interaction is already low in the core system, its deletion thus has a moderate positive effect.
|
| Removing the auto-activation of flia
|
|  
| Damped oscillations. Auto-activation of Flia slows down its dynamics. Without this auto-activation the slope of Flia is similar to the slope of FlhDC. For oscillations to appear, different species need to have comparable time scales : oscillations are much more easier without Flia auto-activation.
|
| Enhancing the inhibition of FlhDC via envZ
|
| 
| Non oscillating system. A stronger inhibition slightly improves the behavior of the system.
|
| Combining three modifications all together.
|
|   
| Damped oscillations with greater amplitude. Combining the three previous variants provides the best possible behavior.
|
The core system cannot provide oscillations. In particular, auto-activation of flia and activation of envZ by FlhDC both have serious negative effects on oscillations. But these actions are required for the FIFO behavior of the system.
In the next section, we examine significant topology improvements of the core system that are potentially better for oscillations and that preserve FIFO required interactions.
Navigator
Back to the overall presentation of our system and model
Top of the page
Mathematical analysis Effects of integration methods
|
 "
"

