IGEM:Cambridge/2008/Notebook/Voltage/K+ Concentrations

From 2008.igem.org

(Difference between revisions)
 
Line 58: Line 58:
Image:KJW1242.JPG|JW1242 Graphical Analysis (Kch-)
</gallery>
</gallery>
-
 
-
presynaptic plasma membrane. The neurotransmitter diffuses through the synaptic cleft and binds to chemical receptor molecules on the membrane of the postsynaptic cell. These receptors cause ion channels to open so that ions rush out, changing the transmembrane potential. Attempting to mimic this in a prokaryotic system is particularly attractive as, in a more general sense, it provides an interface between chemical or biological and electrical systems.'''
 

Latest revision as of 17:50, 29 October 2008

x

Method

  • Five different mutant strains were selected for investigation, based on their growth data and theoretical prediction about potassium sequestration capability. (See mutants information)
  • Six different concentrations of potassium were prepared by adding 1ml of 10x KCl stock solution to 9ml NOK broth, to make final [K+] of 0, 1, 5, 10, 50 & 200mM.
  • Each mutant was innoculated into 10ml NOK samples of different potassium concentrations, and grown overnight at 37°C in a shaking incubator.
  • In the morning, OD600 recorded in 1ml cuvette and converted into cell number using calibration graph. Cells were kept on ice at all times after this.
  • 500ul of this culture was extracted & centrifuged (5 min, low speed.)
  • Supernatant removed and discarded (no further analysis due to viscosity problems)
  • Pellet washed (resuspend in 1ml SDW and centrifuge 5 min, low speed.)
  • Pellet resuspended in 1.5ml SDW, cells then fractured by 3 rounds of freeze-thaw lysis in liquid nitrogen.
  • Flame photometry performed on most sensitive setting (See calibration graph)
  • This was converted into data below using our 'Potassay'(potassium assay) spreadsheet.
  • Four repeats were performed during the course of the day.

Results

Potassay raw data & calculations in Excel spreadsheet

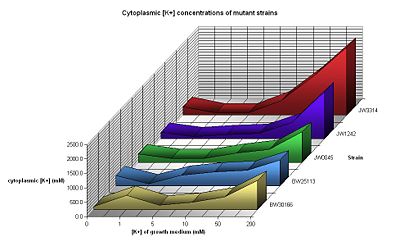
Kallstrains.JPG
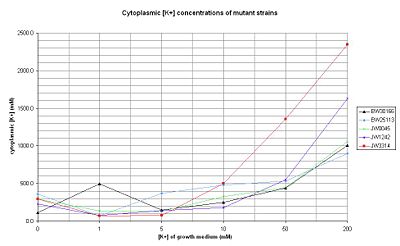
Kallstrains2.JPG


Note: small horizontal markers above and below points on graphs shown indicate range of data (results from 4 repeats)


x