Team:UCSF/Synthetic Chromatin Properties
From 2008.igem.org
Raquel Gomes (Talk | contribs) |
Raquel Gomes (Talk | contribs) |
||
| Line 1: | Line 1: | ||
| - | |||
| - | |||
| - | |||
| - | |||
[[Image:minusgalactose_pluspheromone.png]] | [[Image:minusgalactose_pluspheromone.png]] | ||
[[Image:plusgalactose_minuspheromone.png]] | [[Image:plusgalactose_minuspheromone.png]] | ||
| Line 37: | Line 33: | ||
<h2 align="justify">Analysis of our Data</h2> | <h2 align="justify">Analysis of our Data</h2> | ||
<p align="justify">Single-cell analysis was done using flow-cytometry. Flow cytometry measurements were taken using a BD LSR-II flow cytometer (BD Biosciences). For each sample, 10,000 cells were counted, and GFP fluorescence was measured by exciting at 488 nm with a 100 mW Coherent Sapphire laser. Cells that were positive for GFP are seen in the microscope images on the lower right panel and their predicted population distribution is shown in the green curve in the ficticious graph in the left (below).</p> | <p align="justify">Single-cell analysis was done using flow-cytometry. Flow cytometry measurements were taken using a BD LSR-II flow cytometer (BD Biosciences). For each sample, 10,000 cells were counted, and GFP fluorescence was measured by exciting at 488 nm with a 100 mW Coherent Sapphire laser. Cells that were positive for GFP are seen in the microscope images on the lower right panel and their predicted population distribution is shown in the green curve in the ficticious graph in the left (below).</p> | ||
| - | <p align="center"><img src=" | + | <p align="center"><img src="https://static.igem.org/mediawiki/2008/2/2b/Analysis_data.jpg" width="750" height="458" /></p> |
<p align="justify"> </p> | <p align="justify"> </p> | ||
<h2 align="justify">The Properties of Our Synthetic Chromatin Bit</h2> | <h2 align="justify">The Properties of Our Synthetic Chromatin Bit</h2> | ||
| Line 44: | Line 40: | ||
<h3 align="justify">1. Targeting of Sir2 leads to complete silencing of reporter</h3> | <h3 align="justify">1. Targeting of Sir2 leads to complete silencing of reporter</h3> | ||
<p align="justify">text here</p> | <p align="justify">text here</p> | ||
| - | <p align="center"><img src=" | + | <p align="center"><img src="https://static.igem.org/mediawiki/2008/d/dc/Minusgalactose.png" width="550" height="159" /></p> |
| - | <p align="center"><img src=" | + | <p align="center"><img src="https://static.igem.org/mediawiki/2008/5/57/Plusgalactose.png" width="550" height="217" /></p> |
<p align="justify"> </p> | <p align="justify"> </p> | ||
<blockquote> | <blockquote> | ||
| Line 51: | Line 47: | ||
</blockquote> | </blockquote> | ||
<p align="justify"> </p> | <p align="justify"> </p> | ||
| - | <p align="center"><img src=" | + | <p align="center"><img src="https://static.igem.org/mediawiki/2008/4/45/Galactose_R.jpg" width="500" height="359" /></p> |
<p align="justify">Similar results were obtained for other promoters (e.g. Fig1 P, see below).</p> | <p align="justify">Similar results were obtained for other promoters (e.g. Fig1 P, see below).</p> | ||
<h3 align="justify">2. Dominant over Transcription Factors</h3> | <h3 align="justify">2. Dominant over Transcription Factors</h3> | ||
| Line 57: | Line 53: | ||
<p align="justify">text here</p> | <p align="justify">text here</p> | ||
<p align="justify"> </p> | <p align="justify"> </p> | ||
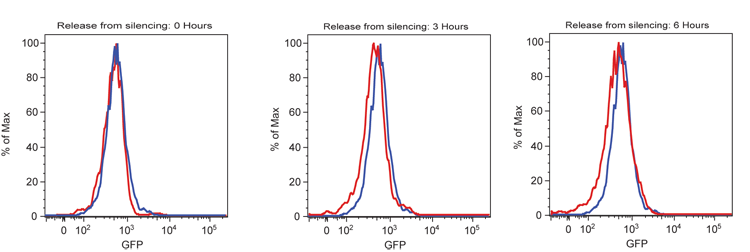
| - | <p align="center"><img src=" | + | <p align="center"><img src="https://static.igem.org/mediawiki/2008/3/33/Minusgalactose_pluspheromone.png" width="550" height="169" /></p> |
<p align="center"> </p> | <p align="center"> </p> | ||
| - | <p align="center"><img src=" | + | <p align="center"><img src="https://static.igem.org/mediawiki/2008/b/b7/Plusgalactose_minuspheromone.png" width="550" height="212" /></p> |
</blockquote> | </blockquote> | ||
<p align="justify"> </p> | <p align="justify"> </p> | ||
Revision as of 21:21, 28 October 2008
Design of our System (previous)
Synthetic Chromatin Bit (Part II)
Why use Chromatin as a Tool for Synthetic Biology?
text here
Analysis of our Data
Single-cell analysis was done using flow-cytometry. Flow cytometry measurements were taken using a BD LSR-II flow cytometer (BD Biosciences). For each sample, 10,000 cells were counted, and GFP fluorescence was measured by exciting at 488 nm with a 100 mW Coherent Sapphire laser. Cells that were positive for GFP are seen in the microscope images on the lower right panel and their predicted population distribution is shown in the green curve in the ficticious graph in the left (below).
The Properties of Our Synthetic Chromatin Bit
We studied how our yeast synthetic chromatin system behaves...
1. Targeting of Sir2 leads to complete silencing of reporter
text here
RESULT 1:
Similar results were obtained for other promoters (e.g. Fig1 P, see below).
2. Dominant over Transcription Factors
text here
RESULT 2:
text here
3. Regional Silencing
text here
RESULT 3:
text
4. Binary
text here
5. Memory
text here
RESULT 5:
text here
| Home | The Team | The Project | Parts Submitted to the Registry | Modeling | Human Practices | Notebooks |
|---|
 "
"


