Imperial College/5 September 2008

From 2008.igem.org

August
MTWTFSS
        1 2 3
4 5 6 7 8 9 10
11 12 13 14 15 16 17
18 19 20 21 22 23 24
25 26 27 28 29 30 31
September
MTWTFSS
1 2 3 4 5 6 7
8 9 10 11 12 13 14
15 16 17 18 19 20 21
22 23 24 25 26 27 28
29 30
October
MTWTFSS
    1 2 3 4 5
6 7 8 9 10 11 12
13 14 15 16 17 18 19
20 21 22 23 24 25 26
27 28 29 30 31

5 September 2008

Wetlab

Cloning

  • PCR reaction to clone the LacI gene using Pfu set up - standard condtitions and reagents[1]; 56°C for the first 10 cycles, 65°C for the 20 cycles.
  • Testing PCR reactions (3) for the Biobrick insert size verification primers (with the pSB1AK3 vector) set up - taq conditions and reagents; at 60°C, 58°C or 56°C for 30 cycles
  • GeneArt construct 7, 8, 9 and 11 digests, CAT digest and pSB1A2 digest and the insert (excluding for pSB1A2)purified by gel-purification (pSB1A2 vector minus insert was purified)
  • AmyE 5', AmyE 3' and Aad9 PCR reactions digested with XbaI and SpeI for cloning into Biobricks and PCR purified
  • Terminator Biobrick digested and PCR purified to remove Prefix fragment

Colony Counting

After re-calibrating our illuminator, it can now count colonies with a fair degree of accuracy. Manual addition and removal of points allows us to fine-tune the results, so we will use this method from now on.

Trial Run: B. subtilis Growth Curve

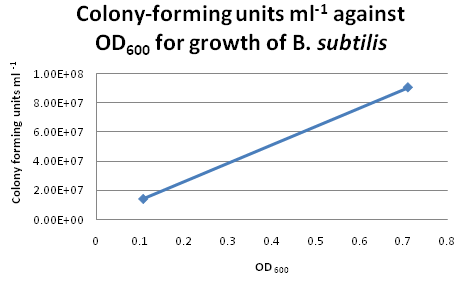
In our second trial run to obtain growth and calibration curves for B. subtilis, we cultured our "B. subtilis" for two days and monitored the changes in OD600 continuously. By plotting OD600 against time/h, we obtained the following growth curve for "B. subtilis".

Growth Curve for B. subtilis from trial run

Calibration Curve

For six of the data points from the above growth curve, we plated 0.1 ml of B. subtilis on LB agar plates and performed serial dilutions in order to calculate the colony-forming units (CFU per ml) for the corresponding OD600. However, we only managed to obtain two sets of valid data. The B. subtilis mixtures we plated for higher values of OD600 were too dilute, hence no bacterial growth was observed on these LB agar plates.

Growth Curve for B. subtilis from trial run

Suggestions for Further Improvements

For the official experiment to obtain our calibration curve, we should take the following precautions:

  • Pipette tips should be changed after each transfer of solution during serial dilution. This would avoid contamination and produce more accurate results for the calibration curve.
  • Choose dilution factors for plating more carefully. It is not advisable to choose very high dilution factors e.g. those higher than 10E8.
  • Check OD600 readings more frequently during the exponential growth phase. This would ensure a more even distribution of data points for the calibration curve.

Dry Lab

Motility

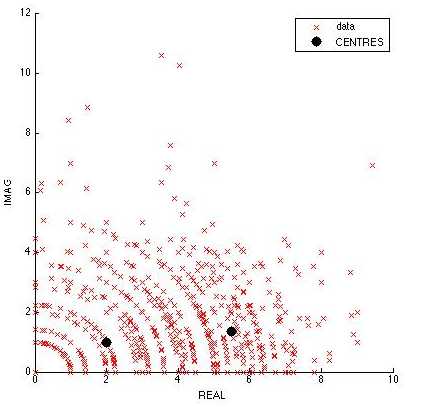
  • 10 cells were tracked manually from Video 3. The graph of Z=Rexp(i*X) was plotted, R being the displacement and X being the angle between three consecutive coordinate points. It is hypothesised that tumbling will occur with very low displacement and high angle, while running occurs with large displacement and low angle.
  • It was found that segmentation could not be done visually. However, using subtractive clustering analysis in the "Find Cluster Toolbox" in MATLAB, we were able to identify 2 centers of clustering, representing tumbling and running. However, more data has to be obtained to visually identify running and tumbling clusters.
Complex Plot of Velocity*exp(i*Angle)

Microscopy

2 microscopy sessions will be arranged for next week, on Wednesday and Friday.