Optical Density
In order to test the mechanism of the SRRz lysis cassette, we took optical density measurements as cell lysis occurred. The construct we used for testing was contained on the pVJ4 plasmid. This plasmid was obtained from the Mekalanos lab at HMS and contained the SRRz gene cassette in a pBAD18 plasmid.
Initially we introduced arabinose to the culture of cells, allowed the cultures to sit at room temperature for several hours and measured the optical density before and after the cells lysed. The results are displayed in Figure 1. It was observed that when cells lysis occurred, the solution of lysing cells cleared after a few hours, providing qualitative evidence that lysis occurred (Figure 2).
 Figure 1: This data indicates that significant lysis occurs after a period of approximately 12 hours, confirming that the lysis cassette functions as predicted. The optical densities are standardized to the control. 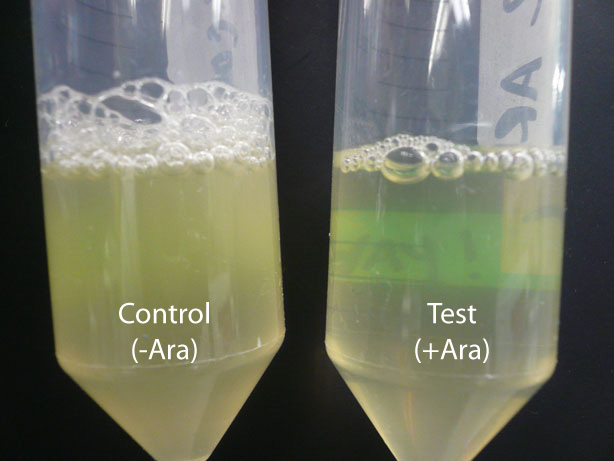 Figure 2: The culture on the left has no Arabinose added and the cells did not lyse. The tube on the right had 0.2% Arabinose by mass added and the cells lysed.
Next, we wanted to test the amount of time required for lysis to occur. We added 0.2% by volume of an arabinose stock solution to cell cultures and measured the optical densities of the cultures at discrete time points. The following graphs exhibit optical density trends during gene expression and resulting cell lysis and cell wall degradation. Figure 3A shows a test measuring optical density and correlates that data to a predicted change in resistance that should occur as the cells lyse. Figure 3B shows another test of change in optical density over time.
 Figure 3A Optical Density WRT Time  Optical Figure 3B Density WRT Time
Optical density of the cell cultures significantly dropped between 1 and 2 hours after induction, signifying the expression of the lysis gene cassette. Notice that optical density increases slightly within the first hour of the test, due to continued cell growth before the lytic event. The predicted change in resistance reflects this period of cell growth.
NaCl Resistance Testing
 Figure 4: We took the resistance of the varying concentrations of salt solutions in order to determine the sensitivity of our system. Readings of resistance were taken for 60 seconds for each solution. - Resistance measurements of different concentrations of salt were performed to determine the sensitivity of our apparatus. Initially, we created NaCl salt solutions of different concentrations and measured the resistance of each solution (Figure 4) with our final resistance apparatus (details in the "Testing" page). Salt solutions of different concentrations were placed in various wells of 6 well plates and resistance readings of each solution were taken for 60 seconds, with 10 readings per second.
 Figure 5: Resistance measurements of NaCl concentrations at 0.006M and 0.00605M. Our system was not capable of detecting a difference between these two concentrations of salt.
- Next, we wanted to test whether our system was sensitive enough to detect the change in ionic concentration that would occur after cell lysis occurs. The concentration of ions in M9 minimal media was calculated to be 0.006M salt. When cells lyse and their ions are released into solution, the final solution should have a total ionic concentration of 0.00605M salt (Calculations in lab notebook) NaCl solution of these two concentrations were created and their resistances were measured with our system. Figure 5 shows that our system was not sensitive enough to measure the change in ionic concentration that would occur after lysis.
We then reasoned that, if more ions were released into the solution, the more detectable the change in resistance should be. Therefore, if we concentrated the solution of cells a significant amount, a change in resistance should be observed. After further salt tests and calculations, it was determined the number of ions released by a 10mL culture of cells concentrated 50x should be detectable by our resistance apparatus.
Bacterial Resistance Testing
In order to test whether a change in resistance could be detected by a 50x concentration of cells, a test was conducted in which the resistance of the supernatant of a 50x concentrated cell solution was measured before and after lysis.
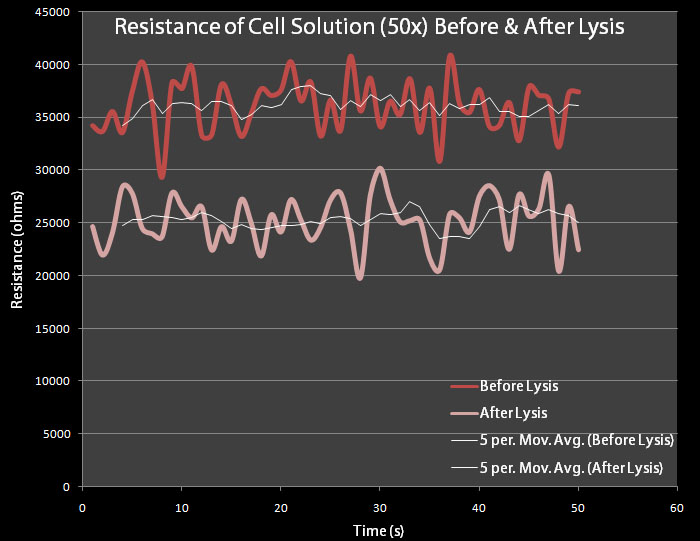 Figure 6 This test was done with 50X concentrated pVJ4 E. coli bacteria grown in LB Lennox and resuspended in M9 Minimal Media. Cultures were made overnight. Resistance was measured for 60 seconds before and after lysis had occurred.
The control cells contain plasmid pRG1 which contains the cell lysis cassette under the Lac promoter. The test cells contain the pVJ4 plasmid.
500 mL dilutions of both pRG1 and pVJ4 were made in LB Lennox and then centrifuged. The giant pellets were resuspended in 10mL of M9 Minimal Media. 0.2% arabinose was added to the pVJ4 culture with a 50% Arabinose Solution Our resistance apparatus recorded measurements overnight. Figure 6 shows the resistance readings before lysis and after lysis. Figure 6 shows a decrease in resistance, which suggests cell lysis has occurred.
Conductivity Testing
 Figure 8: This is a test of cells with pVJ4 (which has the lysis cassette) and PRG-1(control), with 0.2% Arabinose added to both. The PRG-1's conductance was measured before and after lysis (approximately 12 hours after induction with arabinose and pVJ4 was measured continuously, due to limited equipment.
- As cells lyse, the conductance of the solution should increase. In Figure 8, both the cells with the pVJ4 plasmid and cells with the pRG1 plasmid were exposed to 0.2% arabinose. The cells with the pRG1 plasmid (SRRz under PlacI) served as the control since they were proven to not lyse in the presence of arabinose. The graph suggests that conductance does increase as the cells lyse. Notice that the sharp increase in conductance of the cells with pVJ4 occurs after approximately 2 hours, which the optical density experiments showed was approximately the time lysis occurs after arabinose induction.
|
 "
"


