Software
- Java
- ImageJ
A. Java
A simple Java program is used to automate the picture capturing process.
This Java program will simulate a mouse left-click for every INTERVAL ms, and will stop after DURATION ms.
import java.awt.AWTException;
import java.awt.Robot;
import java.awt.event.InputEvent;
public class MouseController implements Runnable {
private Robot robot;
private volatile boolean stop = false;
// you can adjust these two variables for your own needs.
private static int INTERVAL = 1000;
private static int DURATION = 15000;
public MouseController() {
try {
robot = new Robot();
} catch (AWTException ex) {
ex.printStackTrace();
}
}
public void run() {
while(!stop) {
robot.mousePress(InputEvent.BUTTON1_MASK);
robot.mouseRelease(InputEvent.BUTTON1_MASK);
try {
Thread.sleep(INTERVAL);
} catch (InterruptedException ex) {
ex.printStackTrace();
}
}
}
public synchronized void stop() {
stop = true;
}
public static void main(String[] args) {
MouseController mc = new MouseController();
Thread mcThread = new Thread(mc);
System.out.println("Picture capturing started");
mcThread.start();
try {
Thread.sleep(DURATION);
} catch (InterruptedException ex) {
ex.printStackTrace();
}
mc.stop();
System.out.println("Picture capturing stopped");
}
}
[Back to Top]
B. ImageJ
ImageJ, a powerful medical image analyze tool, is used to measure the plate brightness. The Region of Interest (ROI) is set to the entire plate excluding the edge area where the high level of signal intensity caused by reflection of light source from the plate’s side wall will distort the signal.
The light intensity 3D plot is achieved by using ImageJ’s interactive 3D surface plot plug-in accompanied with the automatic mouse control program. Pattern at each time point will be plotted and finally integrated into a real-time growth pattern.
For example, at a time-point, the following pattern:

Will be plotted like this:

and finally integrate the plot of different time point into a single pattern growth animation.
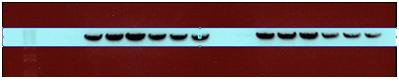
Furthermore, we are hoping to extend this method of measurement to other application, like recording total band brightness on gel photo to measure the chromosome expression level by using ImageJ with its build-in Gel analyze function. (refer to Roy’s design).
The steps to calculate the band is as follow:
After taking the gel photo, use image to open it.

Use rectangular tool to select the band as small as possible to just cover the band
Use Analyze-Gels-Select First Lane (Or Ctrl+1)

Invert the selected ROI
Use mouse pointer to move the square selection to the second lane, select Analyze-Gels-Plot Lane (Or Ctrl+3)

Use Straight Line Selection tool to separate each lane

Use Wand Tools to measure area of each line

Finally, record the result and plot graph
[Back to Top] |
 "
"