Team:Paris/Modeling/f1

From 2008.igem.org

(Difference between revisions)
(Replacing page with 'Image:f2.jpg')
 
(32 intermediate revisions not shown)
Line 1: Line 1:
-
[[Image:f2.jpg]]
+
{{Paris/Menu}}
 +
 
 +
{{Paris/Header|Method & Algorithm : ƒ1}}
 +
<center> = act_''pTet'' </center>
 +
<br>
 +
 
 +
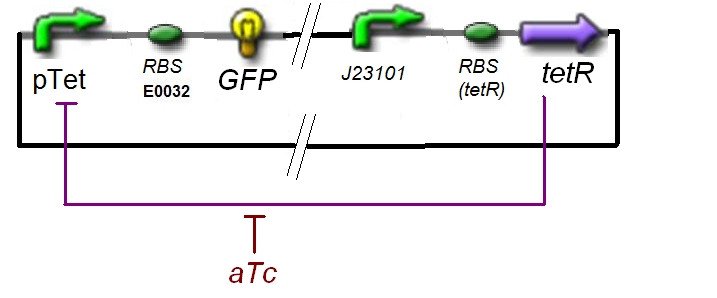
[[Image:f1a.jpg|thumb|Specific Plasmid Characterisation for &#131;1]]
 +
 
 +
According to the characterization plasmid (see right) and to our modeling, in the '''exponential phase of growth''', at the steady state, the experiment would give us
 +
 
 +
[[Image:f1expr.jpg|center]]
 +
 
 +
and at steady-state and in the exponential phase of growth, we expect :
 +
 
 +
[[Image:ExprptetF0.jpg|center]]
 +
 
 +
we use this analytical expression to determine the parameters :
 +
 
 +
<div style="text-align: center">
 +
{{Paris/Toggle|Table of Values|Team:Paris/Modeling/More_f1_Table}}
 +
</div>
 +
 
 +
<div style="text-align: center">
 +
{{Paris/Toggle|Algorithms|Team:Paris/Modeling/More_f1_Algo}}
 +
</div>
 +
 
 +
Also, this experiment will enable us to know the expression of &#131;1 :
 +
 
 +
[[Image:ExprF1.jpg|center]]
 +
 
 +
<br>
 +
 
 +
<center>
 +
[[Team:Paris/Modeling/Implementation| <Back - to "Implementation" ]]| <br>
 +
[[Team:Paris/Modeling/Protocol_Of_Characterization| <Back - to "Protocol Of Characterization" ]]|
 +
</center>

Latest revision as of 02:05, 30 October 2008

Method & Algorithm : ƒ1


= act_pTet


Specific Plasmid Characterisation for ƒ1

According to the characterization plasmid (see right) and to our modeling, in the exponential phase of growth, at the steady state, the experiment would give us

F1expr.jpg

and at steady-state and in the exponential phase of growth, we expect :

ExprptetF0.jpg

we use this analytical expression to determine the parameters :

↓ Table of Values ↑


param signification unit value comments
(fluorescence) value of the observed fluorescence au need for 20 values with well choosen [aTc]i
conversion conversion ration between
fluorescence and concentration
↓ gives ↓
nM.au-1 (1/79.429)
[GFP] GFP concentration at steady-state nM
γGFP dilution-degradation rate
of GFP(mut3b)
↓ gives ↓
min-1 0.0198 Only dilution :
Time Cell Division : 35 min.
ƒ1 activity of
pTet with RBS E0032
nM.min-1


param signification
corresponding parameters in the equations
unit value comments
βtet basal activity of
pTet with RBS E0032
β16
nM.min-1
(Ktet/{coeftetR}) activation constant of TetR><pTet
K13
nM The optimisation program will give us (γ Ktet / {coeftet} ƒ0)
The literature [?] gives Ktet =
ntet complexation order of TetR><pTet
n13
no dimension The literature [?] gives ntet =
KaTc complexation constant aTc><TetR
K12
nM The literature [?] gives KaTc =
naTc complexation order aTc><TetR
n12
no dimension The literature [?] gives naTc =
↓ Algorithms ↑


find_ƒ1

function optimal_parameters = find_f1(X_data, Y_data, initial_parameters)
% gives the 'best parameters' involved in f1 by least-square optimisation
 
% X_data = vector of given values of a [aTc]i (experimentally
% controled)
% Y_data = vector of experimentally measured values f1 corresponding of
% the X_data
% initial_parameters = values of the parameters proposed by the literature
%                       or simply guessed
%                    = [beta16, (K13 -> (gamma.K13)/(coefTet.f0)), n13, K12, n12]
 
% Warning : in the global parameters, K20 -> K20/coefTet
 
     function output = expr_pTet(parameters, X_data)
         for k = 1:length(X_data)
                 output(k) = parameters(1) * (1 - ...
                     hill((1 - hill(X_data(k),parameters(4),parameters(5))),parameters(2),parameters(3)));
         end
     end
 
options=optimset('LevenbergMarquardt','on','TolX',1e-10,'MaxFunEvals',1e10,'TolFun',1e-10,'MaxIter',1e4);
% options for the function lsqcurvefit
 
optimal_parameters = lsqcurvefit( @(parameters, X_data) expr_pTet(parameters, X_data), ...
     initial_parameters, X_data, Y_data, 1/10*initial_parameters, 10*initial_parameters, options );
% search for the fittest parameters, between 1/10 and 10 times the initial
% parameters
 
end

Inv_ƒ1

function quant_aTc = Inv_f1(inducer_quantity)
% gives the quantity of [aTc]i needed to get inducer_quantity of a protein
% throught a gene behind pTet
 
global gamma, f0;
% parameters
 
     function equa = F(x)
         equa = f1( (f0/gamma) , x ) - inducer_quantity;
     end
 
options=optimset('LevenbergMarquardt','on','TolX',1e-10,'MaxFunEvals',1e10,'TolFun',1e-10,'MaxIter',1e4);
 
quant_aTc = fsolve(F,1,options);
 
end

Also, this experiment will enable us to know the expression of ƒ1 :

ExprF1.jpg


<Back - to "Implementation" |
<Back - to "Protocol Of Characterization" |