Team:BCCS-Bristol/Modeling
From 2008.igem.org
(→Bacteria to Particle Adhesion) |
(→Gene Regulatory Network) |
||
| Line 53: | Line 53: | ||
=== Gene Regulatory Network === | === Gene Regulatory Network === | ||
| + | ==== Sender ==== | ||
[[Image:BCCS-Modelling-SenderGRNGraph.jpg|center|thumb|400px|'''Figure 1a: Sender GRN Dynamics''' - Plots showing the mRNA and protein variation when C<sub>pMax</sub> = 5. All states were given initial values of 0]] | [[Image:BCCS-Modelling-SenderGRNGraph.jpg|center|thumb|400px|'''Figure 1a: Sender GRN Dynamics''' - Plots showing the mRNA and protein variation when C<sub>pMax</sub> = 5. All states were given initial values of 0]] | ||
[[Image:BCCS-Modelling-AHL_Variation.jpg|center|thumb|400px|'''Figure 1b: AHL Output''' - Each line represents a different C<sub>pMax</sub> value.]] | [[Image:BCCS-Modelling-AHL_Variation.jpg|center|thumb|400px|'''Figure 1b: AHL Output''' - Each line represents a different C<sub>pMax</sub> value.]] | ||
| + | ==== Transport ==== | ||
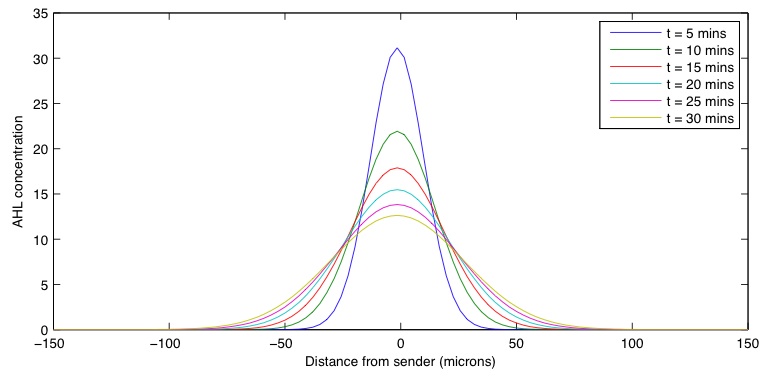
[[Image:BCCS-Modelling-Transport.jpg|center|thumb|400px|'''Figure 2: Transport Results''' - Concentration distribution over a 30 min period for an initial delta function input at 0 of 50]] | [[Image:BCCS-Modelling-Transport.jpg|center|thumb|400px|'''Figure 2: Transport Results''' - Concentration distribution over a 30 min period for an initial delta function input at 0 of 50]] | ||
| + | ==== Reciever ==== | ||
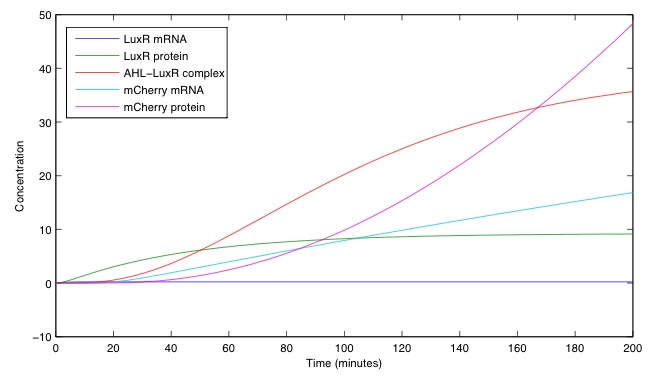
[[Image:BCCS-Modelling-ReceiverGRN.jpg|center|thumb|400px|'''Figure 3a: Reciever GRN Dynamics''' - All states were given initial values of 0, apart from AHL concentration which was set to 3 molecules per cell]] | [[Image:BCCS-Modelling-ReceiverGRN.jpg|center|thumb|400px|'''Figure 3a: Reciever GRN Dynamics''' - All states were given initial values of 0, apart from AHL concentration which was set to 3 molecules per cell]] | ||
[[Image:BCCS-Modelling-mCherryOutput.jpg|center|thumb|400px|'''Figure 3b: mCherry Output''' - Each line represents a different AHL concentration in molecules per cell]] | [[Image:BCCS-Modelling-mCherryOutput.jpg|center|thumb|400px|'''Figure 3b: mCherry Output''' - Each line represents a different AHL concentration in molecules per cell]] | ||
Revision as of 11:58, 22 October 2008
  
|
Approach
Due to the nature of this project, a wide range of modelling techniques are required to help understand ideas and guide experimentation in the wet lab. The reason for this is that in addition to the creation of synthetic genetic circuits to regulate the internal state of a cell, we require the cell to physically interact with the environment in such a way that by bringing a large number of them together, all following to same rules, emergent behaviours are exhibited - the ultimate outcome of the project. To do this it is necessary to take into consideration the movement (chemotaxis) and physical force exerted between large numbers of cells in an environment as well as other aspects such as chemical diffusion, fluid dynamics and individual cell states.
For these reasons we will be developing two types of model, an internal representation of a single bacterium using differential equations, and a external representation of the system as a whole using computerised stochastic agents. This will allow us to gain a better understanding of the different aspects of the project in a manageable way. Once these models have been completed, in an attempt to combine the advantages of each, both will be combined to give a holistic view of the modelling from a single cell to the whole population.
Both types of model will make heavy use of computing resources. We are looking to utilise MATLAB for tasks such as numerical integration and statistical analysis and Java for the development of a stochastic agent based framework that will allow us to simulate bacterial chemotaxis, physical interactions between bacteria/particles and chemical fields exhibiting diffusion. The simulation environment will form the majority of the modelling work and once we can incorporate the GRN dynamics within each bacterium (agent) we hope to be able to perform virtual experiments that mimic those in the wet lab.
The major limitiation of this approach is that the simulation of huge numbers of bacteria requires huge amounts of computing power. This means that for any reasonably sized simulations we will have to seriously consider optimising our code to make most efficient use of local resources (e.g. multi-threading for multiple processor/core machines) and for larger simulations allow for execution on distributed computing architectures. With this in mind we are aiming to gain access to the [http://www.acrc.bris.ac.uk/acrc/hpc.htm Blue Crystal] high performance computing cluster at the university to attempt some large scale simulations.
Models
 |  |  |
| | | |
| To understand the dynamics of genetic networks that we design, differental equations are used to model the changes in concentration of mRNA and proteins. | With the project requiring global behaviour to emerge via the physical en masse movement of bacteria, stochastic agent based simulations are used to investigate the viability and limits of different approaches. | With the aim of improving simulation accuracy this model integrates the intercellular GRN dynamics with the extra-cellular interactions of the stochastic agent based simulation. |
Results
Gene Regulatory Network
Sender
Transport
Reciever
Stochastic Agent Based Model
Basic Chemotaxis Model
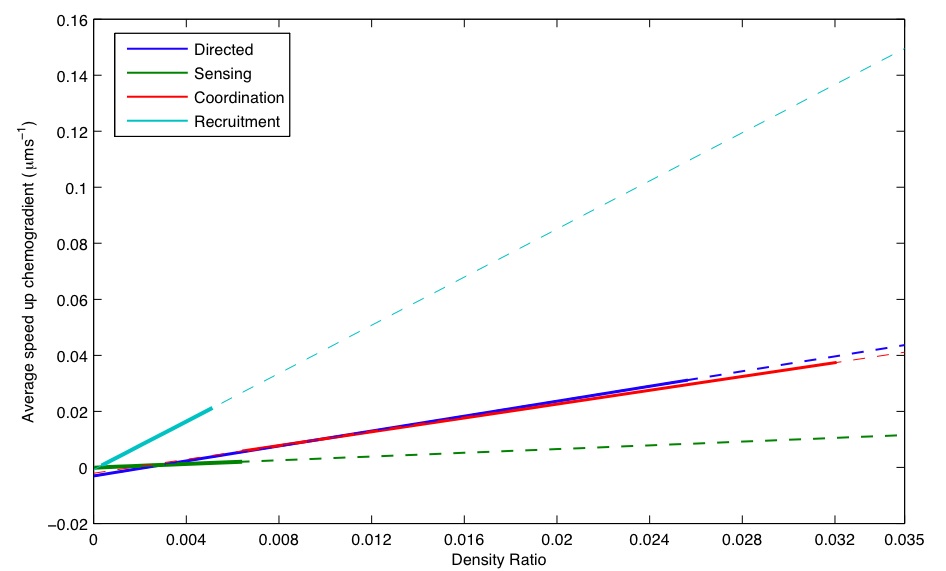
Comparing Construction Rules
Bacteria to Particle Adhesion
Simulation Movies
All simulation movies have been exported from BSim and require [http://www.apple.com/quicktime Quicktime] in order to be viewed. They have each been compressed to reduce their size, however, please be patient when downloading as some are still quite large.
- [http://2008sw.igem.org/bccs_bristol/media/BCCS-Modelling-Basic_Chemotaxis.mov Basic Chemotaxis] - Demonstrates bacteria performing chemotaxis towards a chemoattractant (increasing to the right). The trace displays the average position of all bacteria. This can be seen to move in a random manner with a bias towards the chemoattractant.
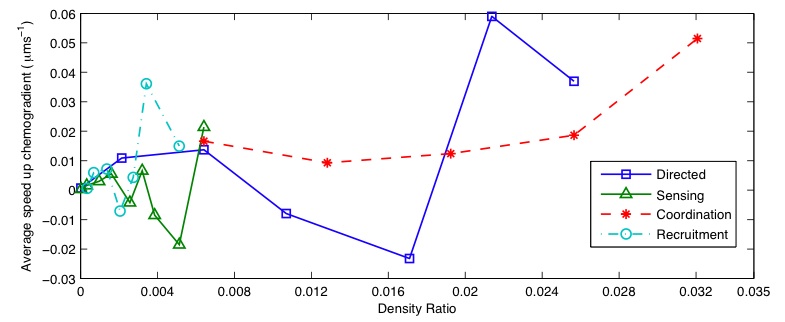
- [http://2008sw.igem.org/bccs_bristol/media/BCCS-Modelling-Direct_Movement.mov Directed Movement] - Shows a particle placed in a swarm of bacteria following the chemotactic gradient. Collisions between bacteria and the particle result in a net movement up the chemotactic gradient.
- [http://2008sw.igem.org/bccs_bristol/media/BCCS-Modelling-Coordination.mov Short Range Co-ordination] - Bacteria are initially not responsive to the chemoattractant. On coming into contact with the particle, a bacterium's chemotactic response is switched on. At the same time a quorum based signal is produced by the bacteria that are in contact with the particle. Neighbouring bacteria switch from a random walk to a chemotactic response on sensing the quorum based signal.
- [http://2008sw.igem.org/bccs_bristol/media/BCCS-Modelling-Recruitment.mov Long Range Recruitment] - The bacteria act as above but on contact with the particle also produce a long range chemotactic based signal, recruiting distant bacteria towards the particle.
- [http://2008sw.igem.org/bccs_bristol/media/BCCS-Modelling-Adhesion.mov Bacteria to Particle Adhesion] - Bacteria are adhered to the particle and follow a chemotactic gradient.
Software Download
To download both compiled versions of BSim and the source code for both BSim and the MATLAB GRN models see our Software Download Page.
Modelling Notebook
- Progress Report - To track our progress see our weekly reports. These let you know what we have been up to, including comments on the reasons behind any important decisions that were made.
- Modelling Parameters - Full listings of all parameters investigated for the modelling part of the project, with values that have been chosen, reasons for their selection and references to the original sources.
- To Do List - List of items that need to be done on the modelling and simulation.
- Batch Simulations - Outline of all simulations we intend to run.
 "
"
