Team:ETH Zurich/Modeling/Genome-Scale Model
From 2008.igem.org
Luca.Gerosa (Talk | contribs) (→Thymidine limitation effects on growth rates) |
(→Genome Scale Analysis) |
||
| Line 12: | Line 12: | ||
==Genome Scale Analysis== | ==Genome Scale Analysis== | ||
In the [[Team:ETH_Zurich/Modeling/Genome_Static_Analysis|Restriction Enzymes Analysis]] modeling section we deal with the analysis of restriction enzymes effects on the genome from the simple point of view of nucleotide sequences and cutting patterns. | In the [[Team:ETH_Zurich/Modeling/Genome_Static_Analysis|Restriction Enzymes Analysis]] modeling section we deal with the analysis of restriction enzymes effects on the genome from the simple point of view of nucleotide sequences and cutting patterns. | ||
| - | This is not informative enough when we try to understand if the key principles of reduction and selection at the base of our minimal genome approach are valid in the context of the whole cell response. It is evident that our selection method for smaller genome size strains is based on the assumption that is possible to control growth rate as a function of its genome size. As explained in the [[Team:ETH Zurich/Project/Overview|Project Overview]], we put a selective pressure on the genome size by combining two effects together: the random reduction of the genome size by restriction enzymes cutting and the feeding of a limited amount of thymidine on a thymidine auxotrophic strain.In this context, one should also consider the effects that the loss of chromosomal parts may have on the physiology of the cell. This scenario needs to be validated using modeling techniques that relate genome content and substrate availability with cell physiology on a system level. Fortunately, in the last ten year huge progress in coding our understanding of biological networks into whole cell comprehensive stoichiometric models. This model typology is called genome scale modeling and we use the most updated genome scale model for our working strain (E. coli K12 MG1655) in order to answer the following questions: | + | This is not informative enough when we try to understand if the key principles of reduction and selection at the base of our minimal genome approach are valid in the context of the whole cell response. It is evident that our selection method for smaller genome size strains is based on the assumption that is possible to control growth rate as a function of its genome size. As explained in the [[Team:ETH Zurich/Project/Overview|Project Overview]], we put a selective pressure on the genome size by combining two effects together: the random reduction of the genome size by restriction enzymes cutting and the feeding of a limited amount of thymidine on a thymidine auxotrophic strain.In this context, one should also consider the effects that the loss of chromosomal parts may have on the physiology of the cell. This scenario needs to be validated using modeling techniques that relate genome content and substrate availability with cell physiology on a system level. Fortunately, in the last ten year huge progress in coding our understanding of biological networks into whole cell comprehensive stoichiometric models. This model typology is called genome scale modeling and we use the most updated genome scale model for our working strain (''E. coli'' K12 MG1655) in order to answer the following questions: |
* Is it possible to slow the growth of a strain by using a thymidine auxotrophic strain and limiting thymidine feeding? How is the thymidine uptake rate (as a function of the thymidin concentration in the medium) quantitatively related to the growth rate in an auxotrophic strain? | * Is it possible to slow the growth of a strain by using a thymidine auxotrophic strain and limiting thymidine feeding? How is the thymidine uptake rate (as a function of the thymidin concentration in the medium) quantitatively related to the growth rate in an auxotrophic strain? | ||
* What is the quantitative effect on growth rate when reducing the genome size of wild type strain (under the assumption of not losing any functionality)? | * What is the quantitative effect on growth rate when reducing the genome size of wild type strain (under the assumption of not losing any functionality)? | ||
| Line 34: | Line 34: | ||
These questions are answered below, in the respective sections. As first we introduce the genome scale model concepts, the Flux Balance Analysis theory and in particular the ''iAF1260'' E.Coli Genome Scale Model developed by [http://gcrg.ucsd.edu/|the Palsson's Group at UCSD], that we modified and used. In the following sections we show the results of simulations for the different questions to be answered.--> | These questions are answered below, in the respective sections. As first we introduce the genome scale model concepts, the Flux Balance Analysis theory and in particular the ''iAF1260'' E.Coli Genome Scale Model developed by [http://gcrg.ucsd.edu/|the Palsson's Group at UCSD], that we modified and used. In the following sections we show the results of simulations for the different questions to be answered.--> | ||
| - | === Genome Scale Models, FBA and E. | + | === Genome Scale Models, FBA and ''E. coli'' K12 MG1655 === |
''Genome scale models'' (1) are biological network reconstructions that effectively map genome annotations (ORFs) to biochemical reactions that define the metabolic network specific to a particular organism. They are also called stoichiometric models because they encode calculation of quantitative relationships of the reactants and products in the balanced biochemical reactions in the organism. When they are enough informative to cover a consistent part of the known organism functions are called ''in-silico'' organisms, bacause it is possible to use them as models to simulate cell system responses. Genome scale models are used in combination with ''Flux Balance Analysis'' in order to predict the physiology (growth rate, uptake rates, yields etc..) of the ''in-silico'' organism depending on variable external nutrient conditions or changes in genome composition (''in-silico'' knockout experiments). In the last decade this modeling technique has proved to give consistent results with experimental data under various heteregeneous conditions of testing (4). Mathematically, Flux Balance Analysis uses the stoichiometric information in order to predict the metabolic flux distribution under the assumption of maximization of a particular cell process (for example maximizing biomass production). Denote N as the stochiometric matrix, V the vector of fluxes and consider the ''Flux Balance Analysis''- assumiption:<br> <!--assumes steady state: <br> --> | ''Genome scale models'' (1) are biological network reconstructions that effectively map genome annotations (ORFs) to biochemical reactions that define the metabolic network specific to a particular organism. They are also called stoichiometric models because they encode calculation of quantitative relationships of the reactants and products in the balanced biochemical reactions in the organism. When they are enough informative to cover a consistent part of the known organism functions are called ''in-silico'' organisms, bacause it is possible to use them as models to simulate cell system responses. Genome scale models are used in combination with ''Flux Balance Analysis'' in order to predict the physiology (growth rate, uptake rates, yields etc..) of the ''in-silico'' organism depending on variable external nutrient conditions or changes in genome composition (''in-silico'' knockout experiments). In the last decade this modeling technique has proved to give consistent results with experimental data under various heteregeneous conditions of testing (4). Mathematically, Flux Balance Analysis uses the stoichiometric information in order to predict the metabolic flux distribution under the assumption of maximization of a particular cell process (for example maximizing biomass production). Denote N as the stochiometric matrix, V the vector of fluxes and consider the ''Flux Balance Analysis''- assumiption:<br> <!--assumes steady state: <br> --> | ||
| Line 73: | Line 73: | ||
=== Different mediums === | === Different mediums === | ||
| - | As explained in the [[Team:ETH Zurich/Project/Overview|Project Overview]] section, the minimal genome, apart of the non-uniqueness, is also | + | As explained in the [[Team:ETH Zurich/Project/Overview|Project Overview]] section, the minimal genome, apart of the non-uniqueness, is also dependent on the environmental conditions. In particular, bacteria have evolved a complex system of regulation in order to express genes depending on the availability of one or the other substrate. So, it results that both, the size and the identity of genes in the minimal genome, will vary of a certain (probably significant) extent. In order to test this prediction using genome scale models, we prepared two different ''in silico'' media. The first one is a rich medium that simulates (as guideline) the content of LB medium, apart from the nucleotides that are not present in order to not disturb the selection mechanism. The second one is a minimal medium, that has glucose as carbon source. Here below we report the composition of our ''in silico'' mediums and their availability: |
* '''Minimal medium''': glucose 0.8 mMol/(h*gDW); oxygen 18.5 mMol/(h*gDW); thymidine is variable; cob(II)alamin 0.0100 mMol/(h*gDW). | * '''Minimal medium''': glucose 0.8 mMol/(h*gDW); oxygen 18.5 mMol/(h*gDW); thymidine is variable; cob(II)alamin 0.0100 mMol/(h*gDW). | ||
| - | * '''Rich medium''': glucose 0.8 mMol/(h*gDW), oxygen 18.5 mMol/(h*gDW), thymidine is variable, cob(II) | + | * '''Rich medium''': glucose 0.8 mMol/(h*gDW), oxygen 18.5 mMol/(h*gDW), thymidine is variable, cob(II)alanin 0.0100 mMol/(h*gDW), alanine, aspartic acid, glutamic acid, glutamine, histidine, glycine, leucine, methionine, proline, threonine, tryosine, arginine, cystine, isoleucine, lysine, phenylalanine, serine, tryptophan, asparagine, sulfate, phosporus (phosphate), zinc, cadmium, mercury, ammonia are not limited. |
Then we performed growth simulations of the wild type strain and obtained maximal growth rate of 0.7367 1/h in minimal medium and 1.1 1/h in rich medium, in good accordance with experimental values. After having assessed these two possible conditions of growth, we can test how the cells respond to the different availability in nutrients. | Then we performed growth simulations of the wild type strain and obtained maximal growth rate of 0.7367 1/h in minimal medium and 1.1 1/h in rich medium, in good accordance with experimental values. After having assessed these two possible conditions of growth, we can test how the cells respond to the different availability in nutrients. | ||
| Line 83: | Line 83: | ||
=== Thymidine limitation effects on growth rates === | === Thymidine limitation effects on growth rates === | ||
| - | The ''iAF1260'' ''in | + | The ''iAF1260'' ''in silico'' model mimics the metabolic network of a wild type ''E. coli'' strain K12 MG1655. In order to simulate what is the cell response when thymidine auxotrophic and under a thymidine limitation, we modified the model by performing an ''in silico'' by performing an ''in silico'' knockout of the ''thyA'' gene |
gene and introducing an external uptake reaction for thymidine. The picture below shows the modifications:<br> | gene and introducing an external uptake reaction for thymidine. The picture below shows the modifications:<br> | ||
[[Image:NucleotideThymSmallSigned.jpg|center|700px|]]<br> | [[Image:NucleotideThymSmallSigned.jpg|center|700px|]]<br> | ||
| Line 106: | Line 106: | ||
=== Genome size effects on growth rates === | === Genome size effects on growth rates === | ||
| - | Nucleotides biosynthesis used in replication of the chromosome are part of the costly processes that a cell has to perform in order to duplicate. We were curious to investigate which kind of advantage a cell acquire if this nucleotide synthesis is reduced, under the hypothesis that the full functionality of the cell was not modified. So using the genome scale model, we calculate the | + | Nucleotides biosynthesis used in replication of the chromosome are part of the costly processes that a cell has to perform in order to duplicate. We were curious to investigate which kind of advantage a cell acquire if this nucleotide synthesis is reduced, under the hypothesis that the full functionality of the cell was not modified. So using the genome scale model, we calculate the maximum growth rate that cells, growing on two different media, could have on different genome sizes. Here below the simulated results:<br> |
[[Image:ChromosomeSizeVsGrowthRate.jpg|center|900px|]]<br> | [[Image:ChromosomeSizeVsGrowthRate.jpg|center|900px|]]<br> | ||
| Line 115: | Line 115: | ||
=== Growth rates as output of whole cell system behaviour === | === Growth rates as output of whole cell system behaviour === | ||
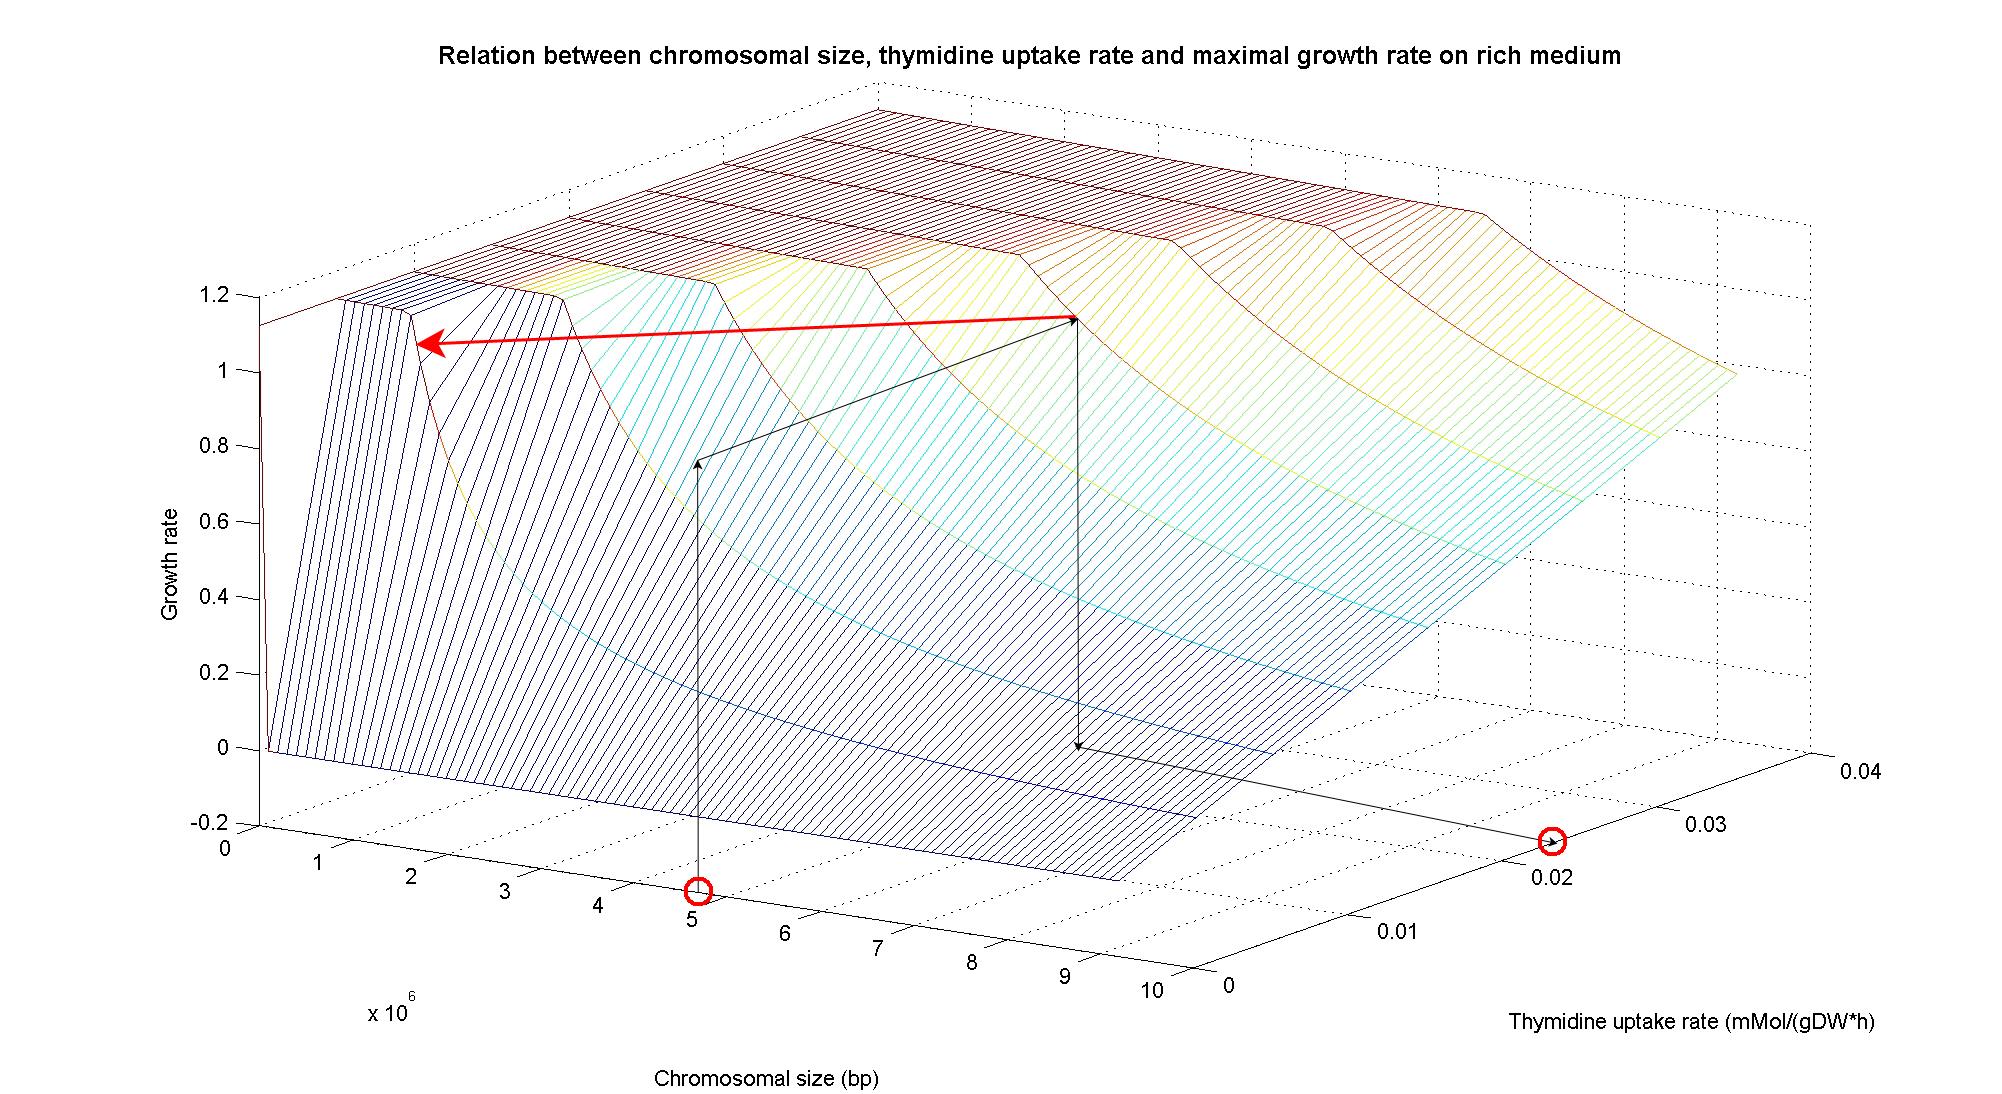
| - | In order to understand the response of thymidine auxotrophic cell to thymidine limitation when the genome size changes, we | + | In order to understand the response of thymidine auxotrophic cell to thymidine limitation when the genome size changes, we perform simulations using ''Flux Balance Analysis''. In this context, we were interested only in quantifying the effect of chromosomal reduction, without considering the possibility of having lost any gene in the operation of reduction. The thymidine concentration varies between 0 and 3 mmMol/(gDW*h) and the chromosome size between 0 and the double size of ''E. coli'' wild type (4.7 Mbp). Below we present the two three dimensional plots that describe the cell's response under minimal and rich medium conditions.<br> |
[[Image:3DPlotMinMedium_arrow.jpg|center|900px|]]<br> | [[Image:3DPlotMinMedium_arrow.jpg|center|900px|]]<br> | ||
| Line 126: | Line 126: | ||
=== Comparing minimal genomes in different medium === | === Comparing minimal genomes in different medium === | ||
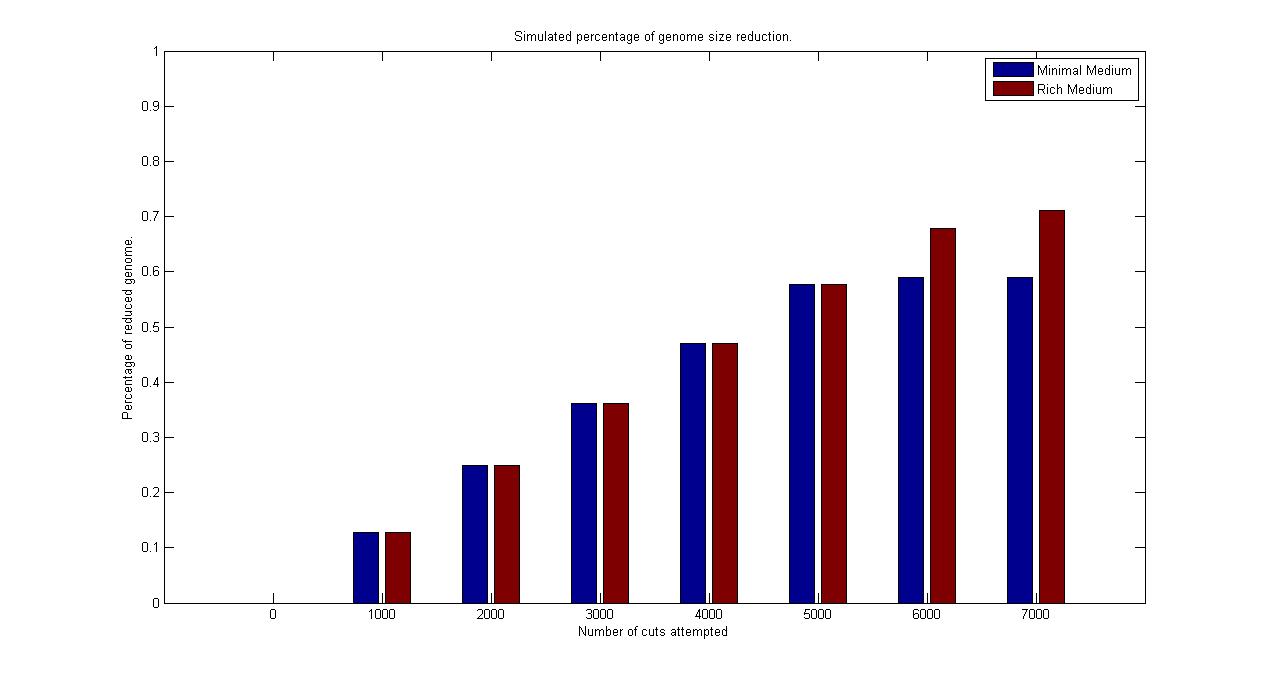
| - | We | + | We implemented a simulation algorithm that mimic our reduction approach and selection mechanism. Since we were interested in understanding how much of the genome we could predict to remove using our approch, we constructed an hypothetical strain that contains only the genes modeled in the genome scale model. This was done due to the fact that almost 70% of the real ''E. coli'' genome is not accounted for in the model (that is, genes are missing in the reconstruction). So we modelled computationally this ''E. coli'' strain that has 1260 genes that reside on a chromosome of 1.3 Mbp size. In this way we assume to be able to project our reduction results on the real complete ''E. coli'' strain without any bias.<br> |
| - | In our simulation we introduced some abstractions, such as the assumption that from each pulse of restriction enzyme expression to the other, we were able to select and bring to the next generation only the fast growing strain. Moreover we assumed that the probability of each fragment to be cut off the chromosome was constant and independent. In this simulation we set it to 0.01, while we wait to have an estimation for the proof of concept experiment that is explained in the lab part, see [[Team:ETH_Zurich/Wetlab/Genome_Reduction|Genome Reduction section]]. Our | + | In our simulation we introduced some abstractions, such as the assumption that from each pulse of restriction enzyme expression to the other, we were able to select and bring to the next generation only the fast growing strain. Moreover we assumed that the probability of each fragment to be cut off the chromosome was constant and independent. In this simulation we set it to 0.01, while we wait to have an estimation for the proof of concept experiment that is explained in the lab part, see [[Team:ETH_Zurich/Wetlab/Genome_Reduction|Genome Reduction section]]. Our parameter corresponds to the term CE*RLE in that section. Then we run the algorithm using the E.coli genome scale model on two different medium, the rich and the minimal ones. Here we give a brief description of the algorithm.<br> |
Starting from the wild type cell, we computed a continuous circle of reduction and selection. For the reduction step, we sampled the probability of each fragment to be cut out from the chromosome and performed the corresponding single knockout simulation for each of the one that sampled as positive. From this population of knockout strains obtained, we calculated each individual growth rate and brought to the next generation only the one with the largest one (abstracting thus all the selection procedure of the chemostat mechanism in one single step). Then using only the survived strain, we repeated the step of reduction and selection, until no one of the random mutation lead to a faster growing strain. | Starting from the wild type cell, we computed a continuous circle of reduction and selection. For the reduction step, we sampled the probability of each fragment to be cut out from the chromosome and performed the corresponding single knockout simulation for each of the one that sampled as positive. From this population of knockout strains obtained, we calculated each individual growth rate and brought to the next generation only the one with the largest one (abstracting thus all the selection procedure of the chemostat mechanism in one single step). Then using only the survived strain, we repeated the step of reduction and selection, until no one of the random mutation lead to a faster growing strain. | ||
Latest revision as of 05:27, 30 October 2008
Genome Scale AnalysisIn the Restriction Enzymes Analysis modeling section we deal with the analysis of restriction enzymes effects on the genome from the simple point of view of nucleotide sequences and cutting patterns. This is not informative enough when we try to understand if the key principles of reduction and selection at the base of our minimal genome approach are valid in the context of the whole cell response. It is evident that our selection method for smaller genome size strains is based on the assumption that is possible to control growth rate as a function of its genome size. As explained in the Project Overview, we put a selective pressure on the genome size by combining two effects together: the random reduction of the genome size by restriction enzymes cutting and the feeding of a limited amount of thymidine on a thymidine auxotrophic strain.In this context, one should also consider the effects that the loss of chromosomal parts may have on the physiology of the cell. This scenario needs to be validated using modeling techniques that relate genome content and substrate availability with cell physiology on a system level. Fortunately, in the last ten year huge progress in coding our understanding of biological networks into whole cell comprehensive stoichiometric models. This model typology is called genome scale modeling and we use the most updated genome scale model for our working strain (E. coli K12 MG1655) in order to answer the following questions:
These questions are answered below, in the respective sections. As first we introduce the genome scale model concepts, the Flux Balance Analysis theory and in particular the iAF1260 E.Coli Genome Scale Model developed by [http://gcrg.ucsd.edu/|the Palsson's Group at UCSD], that we modified and used. In the following sections we show the results of simulations for the different questions to be answered.
Genome Scale Models, FBA and E. coli K12 MG1655Genome scale models (1) are biological network reconstructions that effectively map genome annotations (ORFs) to biochemical reactions that define the metabolic network specific to a particular organism. They are also called stoichiometric models because they encode calculation of quantitative relationships of the reactants and products in the balanced biochemical reactions in the organism. When they are enough informative to cover a consistent part of the known organism functions are called in-silico organisms, bacause it is possible to use them as models to simulate cell system responses. Genome scale models are used in combination with Flux Balance Analysis in order to predict the physiology (growth rate, uptake rates, yields etc..) of the in-silico organism depending on variable external nutrient conditions or changes in genome composition (in-silico knockout experiments). In the last decade this modeling technique has proved to give consistent results with experimental data under various heteregeneous conditions of testing (4). Mathematically, Flux Balance Analysis uses the stoichiometric information in order to predict the metabolic flux distribution under the assumption of maximization of a particular cell process (for example maximizing biomass production). Denote N as the stochiometric matrix, V the vector of fluxes and consider the Flux Balance Analysis- assumiption: The flux solution can be then computed according to a maximization (or the corresponding minimization) function: Once the metabolic fluxes are known,it is possible to calculate physiology parameters. For a complete introduction to these concepts please read this [http://www.nature.com/nbt/web_extras/supp_info/nbt0201_125/info_frame.html Genome Scale Models introduction].
Different mediumsAs explained in the Project Overview section, the minimal genome, apart of the non-uniqueness, is also dependent on the environmental conditions. In particular, bacteria have evolved a complex system of regulation in order to express genes depending on the availability of one or the other substrate. So, it results that both, the size and the identity of genes in the minimal genome, will vary of a certain (probably significant) extent. In order to test this prediction using genome scale models, we prepared two different in silico media. The first one is a rich medium that simulates (as guideline) the content of LB medium, apart from the nucleotides that are not present in order to not disturb the selection mechanism. The second one is a minimal medium, that has glucose as carbon source. Here below we report the composition of our in silico mediums and their availability:
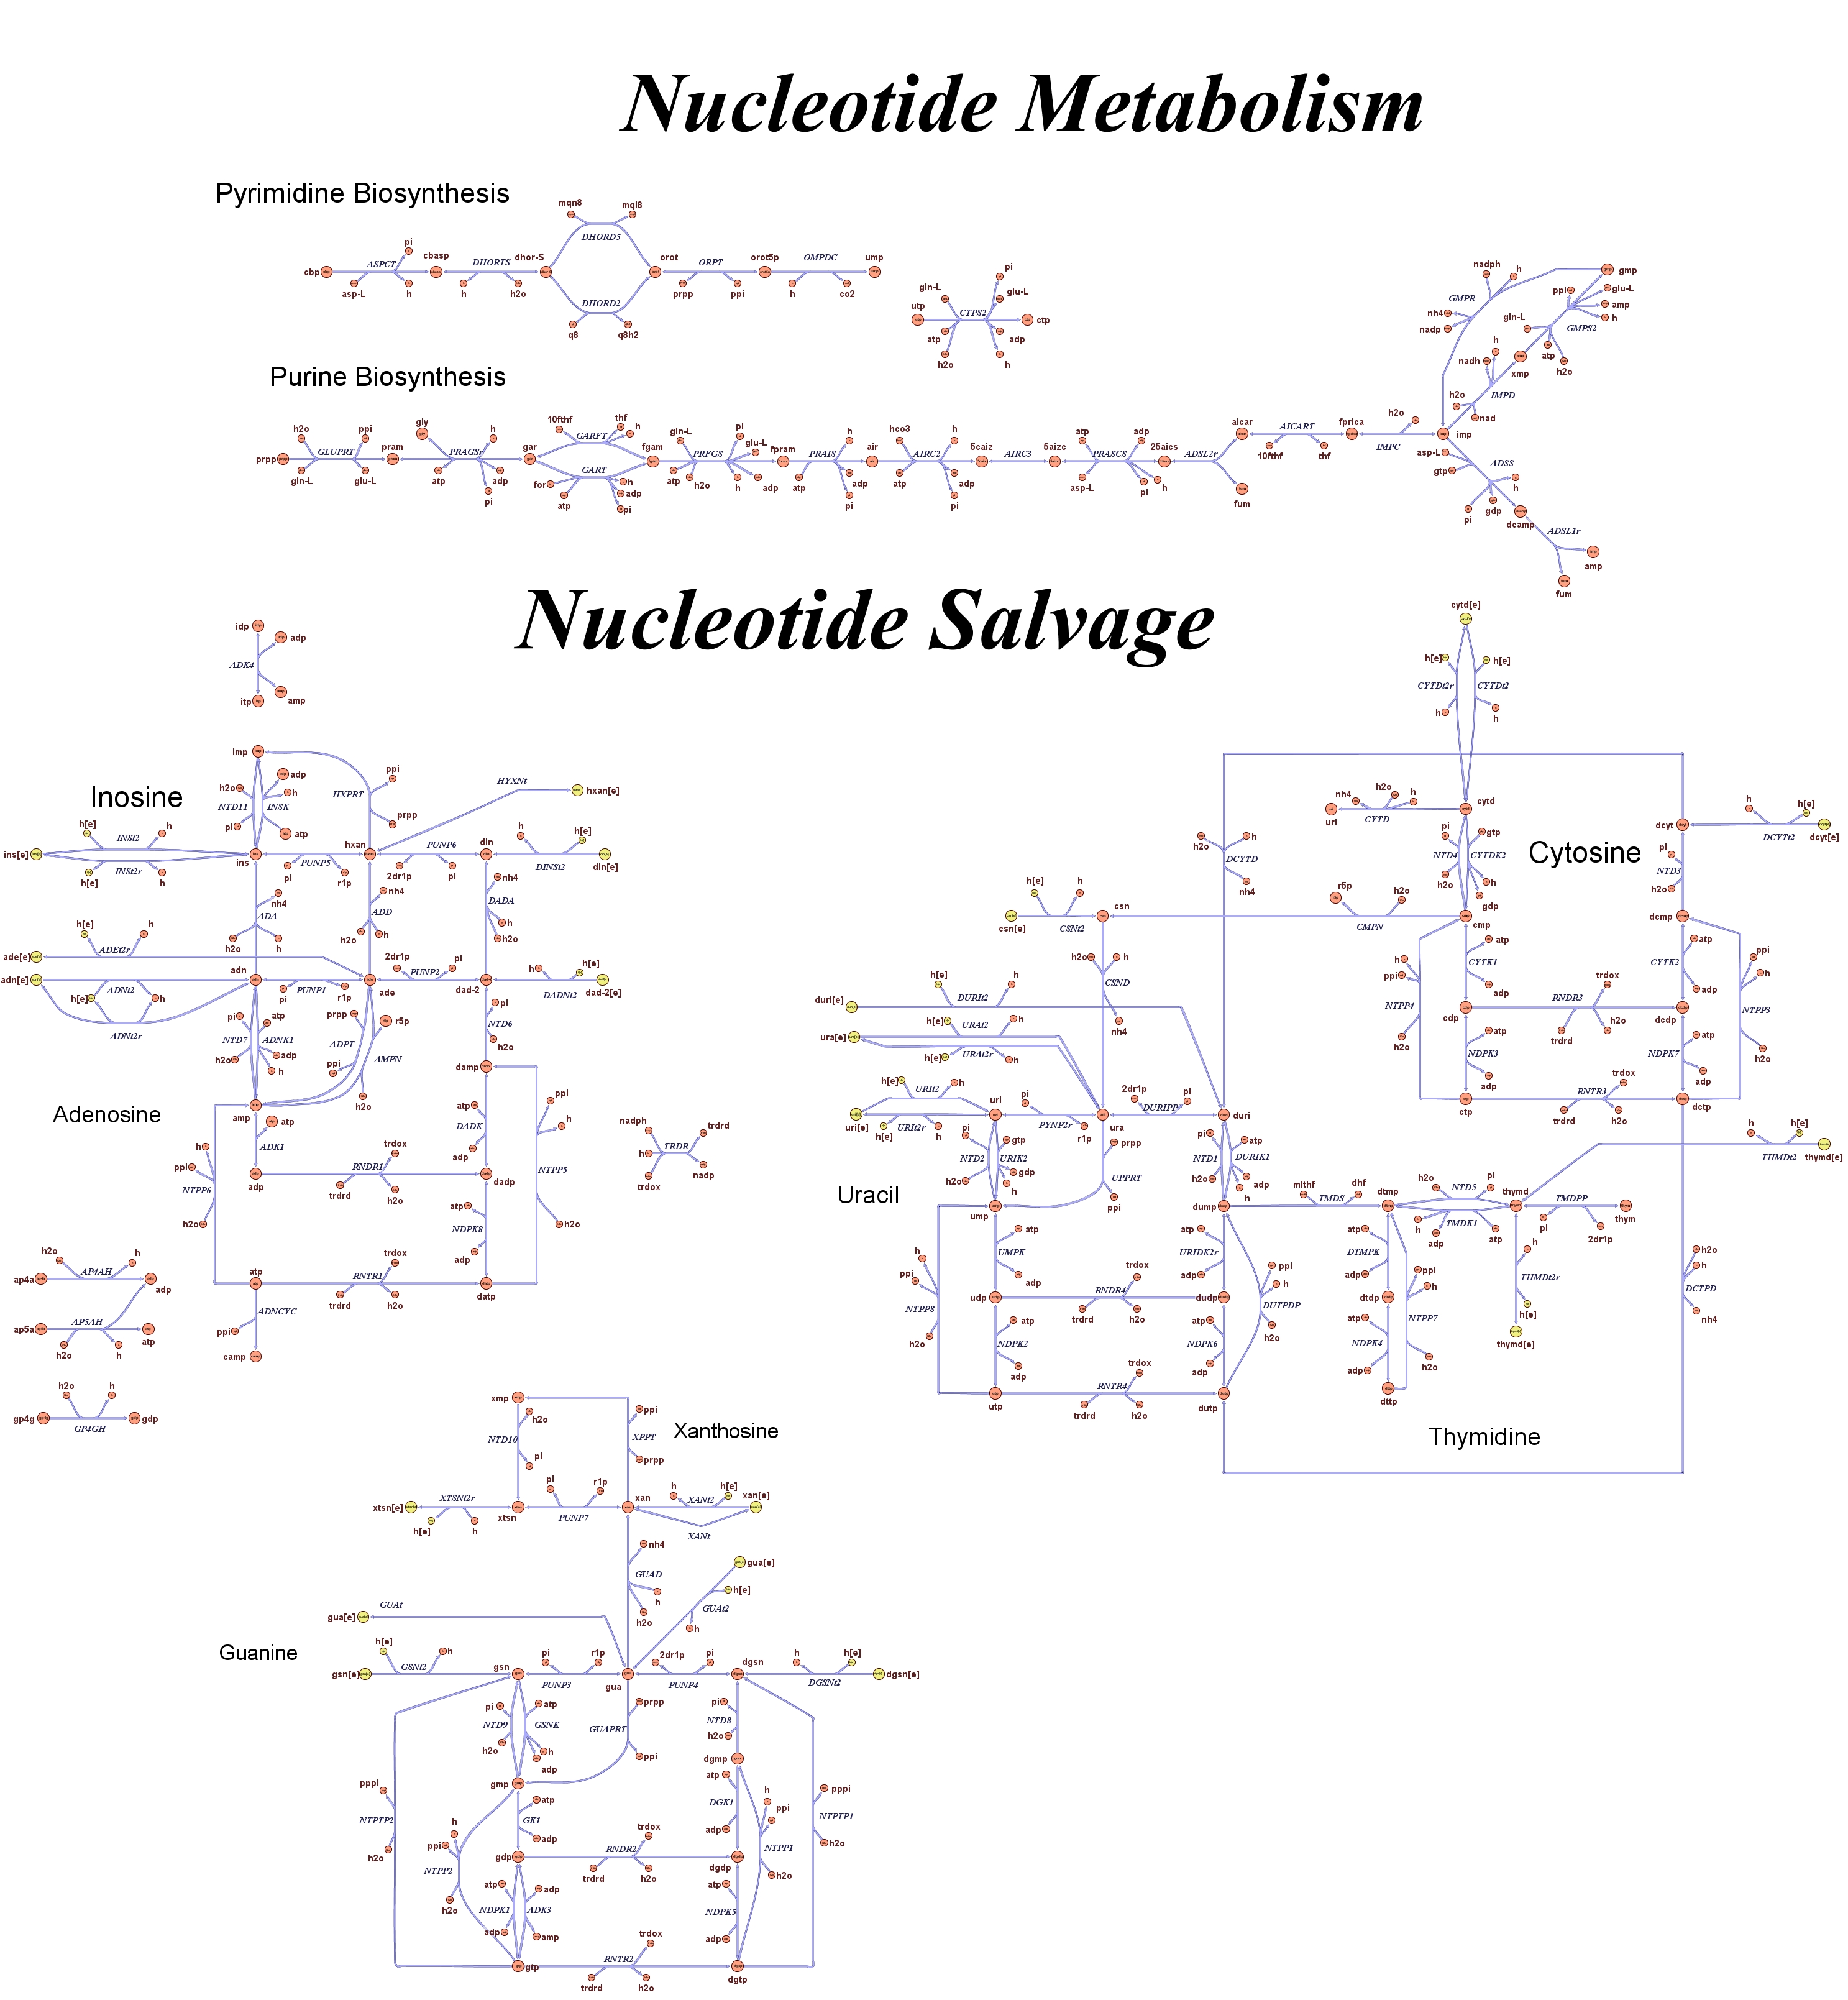
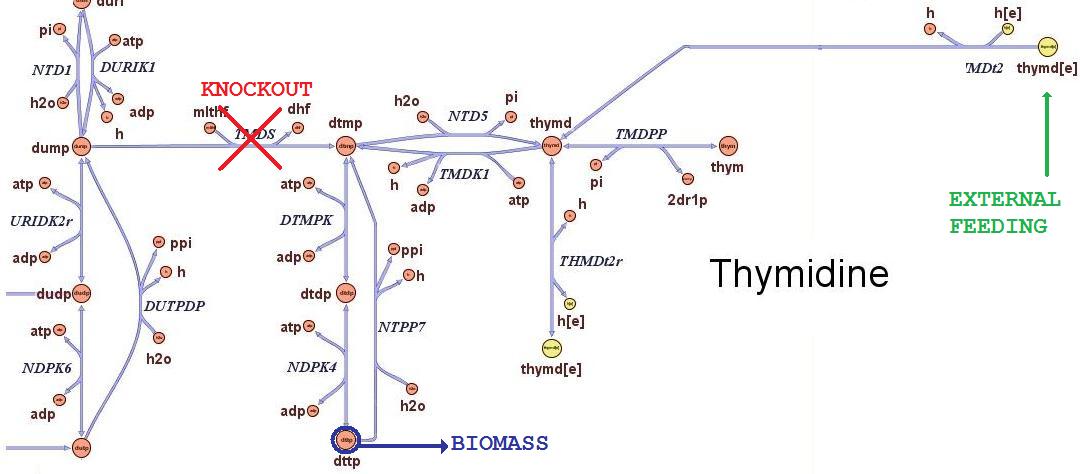
Then we performed growth simulations of the wild type strain and obtained maximal growth rate of 0.7367 1/h in minimal medium and 1.1 1/h in rich medium, in good accordance with experimental values. After having assessed these two possible conditions of growth, we can test how the cells respond to the different availability in nutrients. Thymidine limitation effects on growth ratesThe iAF1260 in silico model mimics the metabolic network of a wild type E. coli strain K12 MG1655. In order to simulate what is the cell response when thymidine auxotrophic and under a thymidine limitation, we modified the model by performing an in silico by performing an in silico knockout of the thyA gene
gene and introducing an external uptake reaction for thymidine. The picture below shows the modifications: Figure 1. The reaction termed TDMS is the thymidylate synthase reaction and has been removed from the model. The resulting model is non vital (growth rate is zero) for medium that do not contain nucleotides, according to experimental tests. The reaction TMDt2 has been set up to uptake a defined amount of thymidine from the medium. This way, the reaction that needs the nucleotides in order to produce biomass has a positive influx and correctly simulates cell growth.
Then we performed simulations varying the thymidine uptake rate of cells on two different medium conditions, minimal and rich medium. The plots below demonstrate that thymidine limitation can be used to control the maximum growth rate of cells.
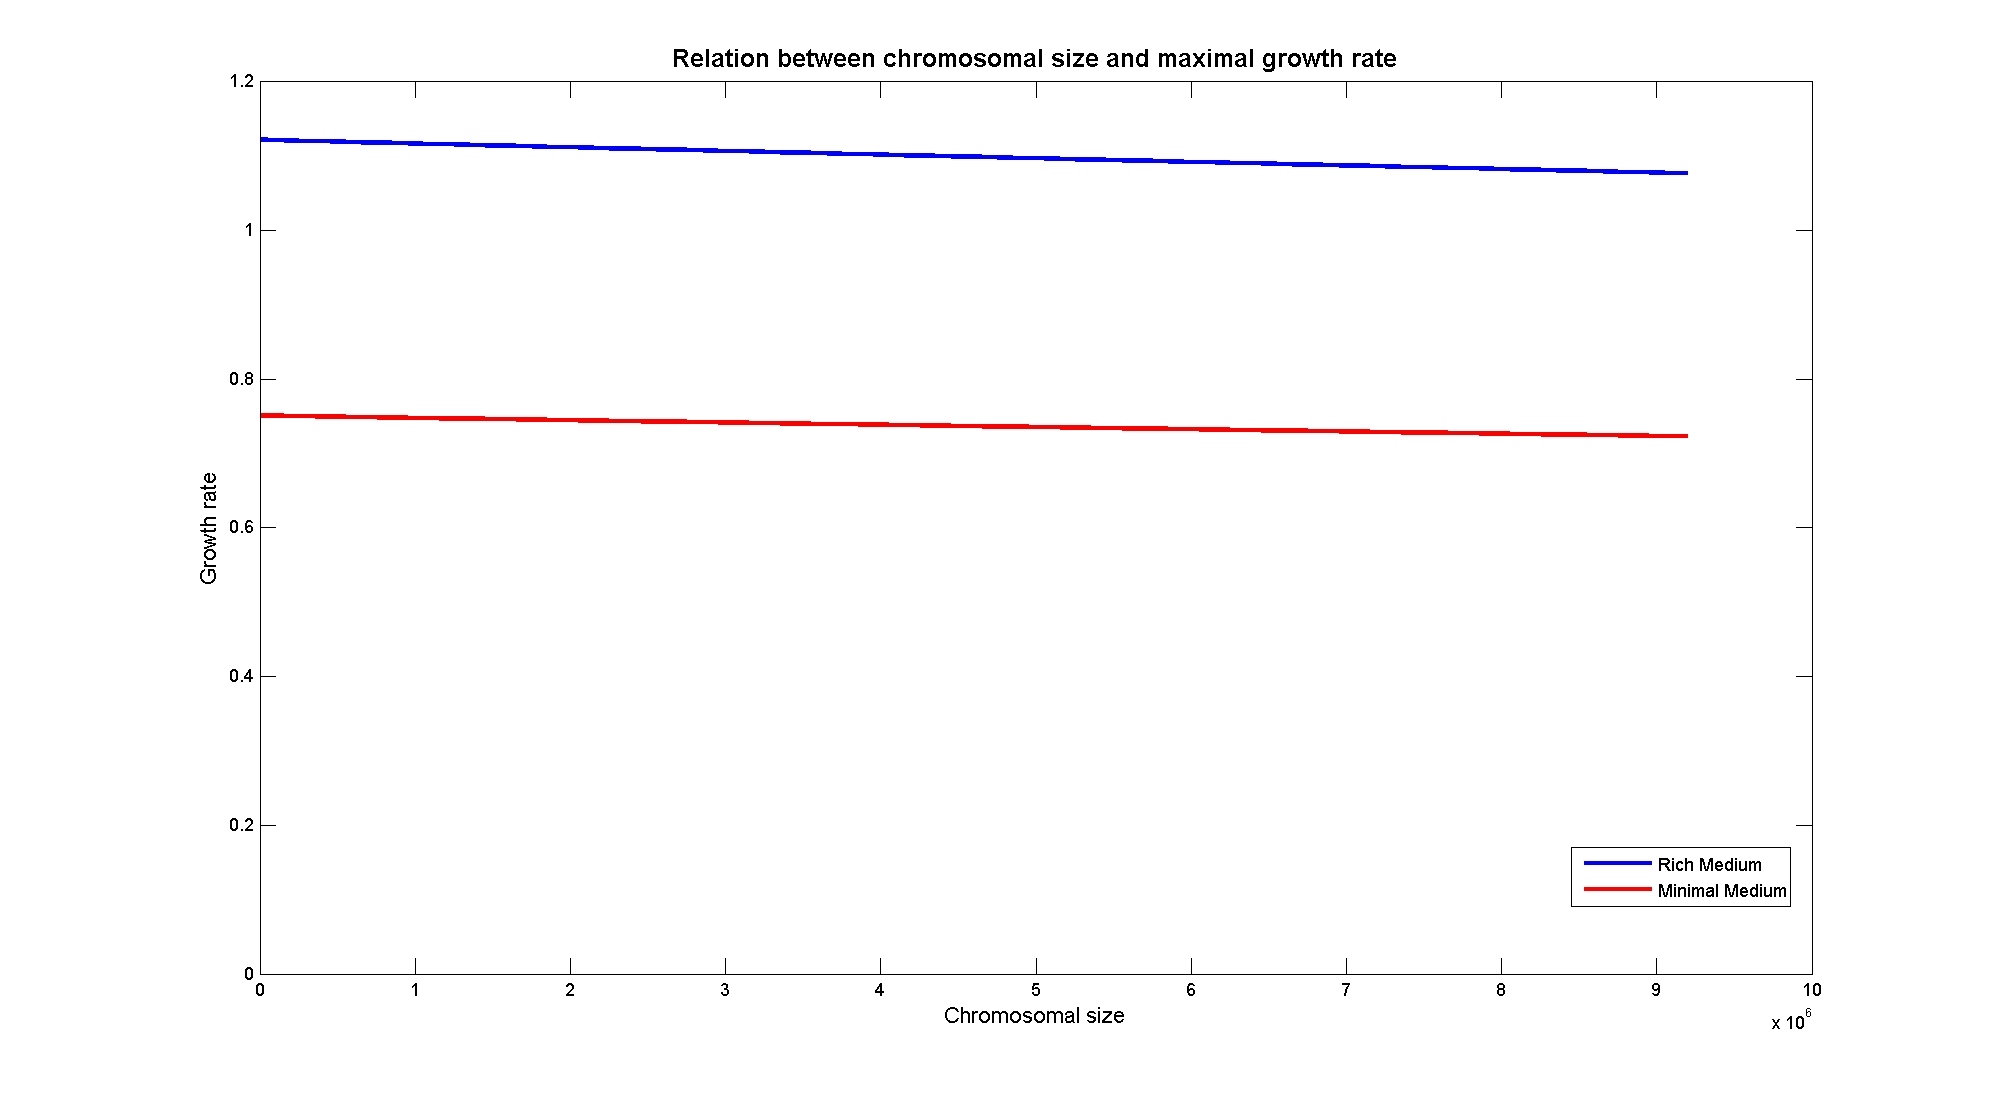
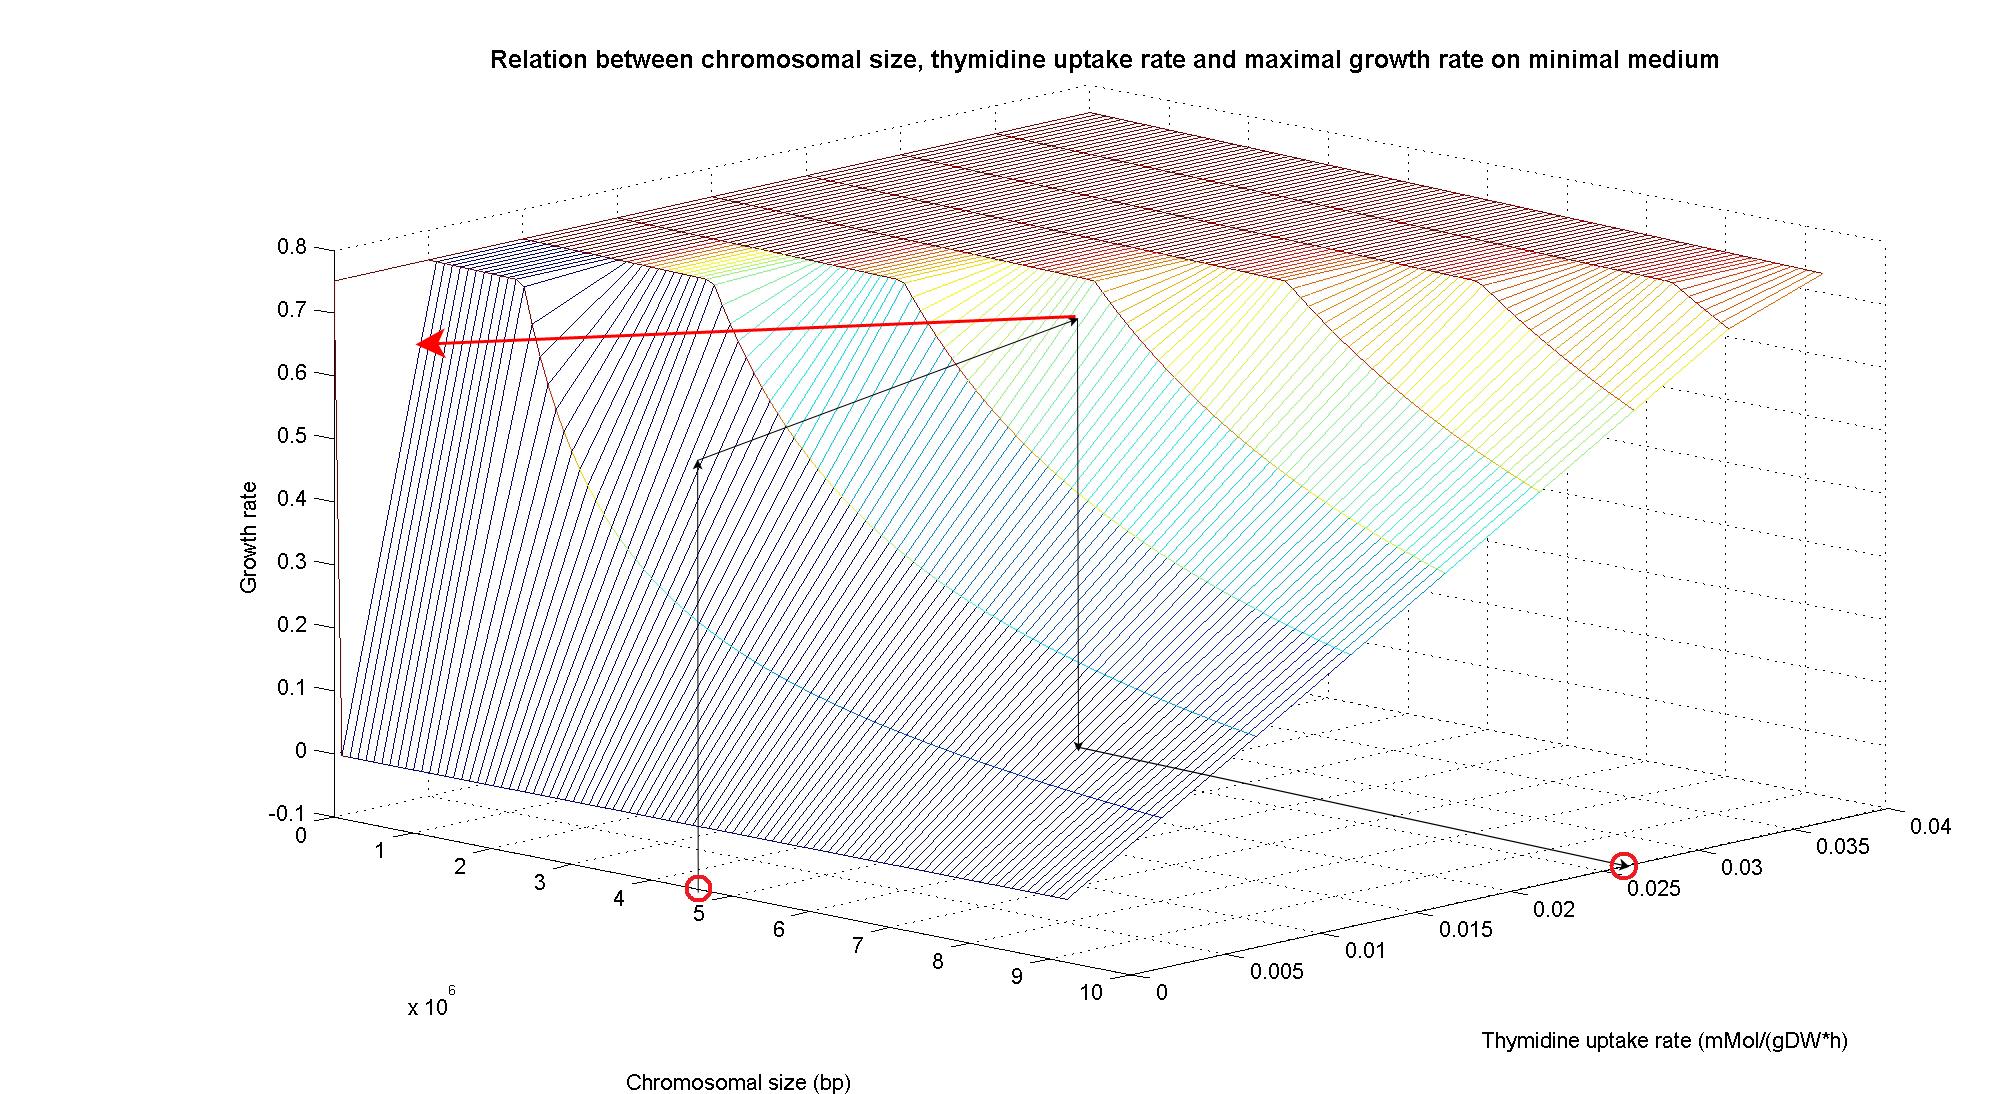
In particular, the simulations show that the growth rate is controlled linearly by the thymidine uptake rate when below a threshold that depends on the medium composition, and that then it is not anymore effective when the growth rate is already maximal. The threshold value is 0.019 (mMol/(gDW*h)) for the minimal medium, it is 0.028 (mMol/(gDW*h)) for the rich medium. These predictions are useful for us in order to understand the thymidine concentrations for our selection mechanism. Genome size effects on growth ratesNucleotides biosynthesis used in replication of the chromosome are part of the costly processes that a cell has to perform in order to duplicate. We were curious to investigate which kind of advantage a cell acquire if this nucleotide synthesis is reduced, under the hypothesis that the full functionality of the cell was not modified. So using the genome scale model, we calculate the maximum growth rate that cells, growing on two different media, could have on different genome sizes. Here below the simulated results: Figure 4. Apparently, a simple reduction in genome size has a very small effect on the growth rate, and the effect is only visible in case of large reductions. Growth rates as output of whole cell system behaviourIn order to understand the response of thymidine auxotrophic cell to thymidine limitation when the genome size changes, we perform simulations using Flux Balance Analysis. In this context, we were interested only in quantifying the effect of chromosomal reduction, without considering the possibility of having lost any gene in the operation of reduction. The thymidine concentration varies between 0 and 3 mmMol/(gDW*h) and the chromosome size between 0 and the double size of E. coli wild type (4.7 Mbp). Below we present the two three dimensional plots that describe the cell's response under minimal and rich medium conditions. Figure 5. Figure 6. The plots are very informative regarding to the effectiveness of our selection method. In fact, they show how to tune the thymidine concentration in the medium in order to obtain the best selection sensitivity (difference in growth rate between similar genome sizes) for a particular range of genome. As highlighted by the red circles, starting from the wild type strain chromosome size (4.7 Mbp) we can calculate the uptake rate of thymidine (0.022 mMol/(gDW*h) in minimal medium and 0.026 mMol/(gDW*h) in rich medium) by projecting the orthogonal arrows. Thus, graphs show that it is possible to maintain cells in a very fast growing condition (above a growth rate of 0.8 in rich medium and above 0.5 in minimal medium) all over the selection procedure, just by following the gradient (of decreasing thymidine concentration) that gives the higher growth rates while decreasing the genome size due to effects of the reduction procedure (red arrow in both graphs). Comparing minimal genomes in different mediumWe implemented a simulation algorithm that mimic our reduction approach and selection mechanism. Since we were interested in understanding how much of the genome we could predict to remove using our approch, we constructed an hypothetical strain that contains only the genes modeled in the genome scale model. This was done due to the fact that almost 70% of the real E. coli genome is not accounted for in the model (that is, genes are missing in the reconstruction). So we modelled computationally this E. coli strain that has 1260 genes that reside on a chromosome of 1.3 Mbp size. In this way we assume to be able to project our reduction results on the real complete E. coli strain without any bias. In our simulation we introduced some abstractions, such as the assumption that from each pulse of restriction enzyme expression to the other, we were able to select and bring to the next generation only the fast growing strain. Moreover we assumed that the probability of each fragment to be cut off the chromosome was constant and independent. In this simulation we set it to 0.01, while we wait to have an estimation for the proof of concept experiment that is explained in the lab part, see Genome Reduction section. Our parameter corresponds to the term CE*RLE in that section. Then we run the algorithm using the E.coli genome scale model on two different medium, the rich and the minimal ones. Here we give a brief description of the algorithm. Starting from the wild type cell, we computed a continuous circle of reduction and selection. For the reduction step, we sampled the probability of each fragment to be cut out from the chromosome and performed the corresponding single knockout simulation for each of the one that sampled as positive. From this population of knockout strains obtained, we calculated each individual growth rate and brought to the next generation only the one with the largest one (abstracting thus all the selection procedure of the chemostat mechanism in one single step). Then using only the survived strain, we repeated the step of reduction and selection, until no one of the random mutation lead to a faster growing strain. All over the simulation, the best reduction obtained (that is, the strain that survived the selection) at each step was stored and is visualized in the plot above. We synchronized the runs for different medium on the number of fragments cut that were attempted in order to obtain that best current reduction. Figure 7. Even if the figure above is only one of the possible random walks that search for the minimal genome in the vast existing solution space, it is quite informative. It is possible to observe how the algorithm (under the previously described assumptions) has a linear relation when comparing genome size reduction with the number of fragment cut attempted. It is possible to see that it predicts a final reduction for a strain growing in rich medium of the 71% of wild type genome size, while it is of 59% for the strain growing in minimal medium. This corresponds in terms of genes in a reduction of 73% in the rich medium case and of 61% in the minimal medium. The simulation assumed the strain growing in minimal medium to be uptaking thymidine with a constant rate of -0.002 (mMol/gDW*h) while the strain growing in reach medium to be uptaking thymidine with a constant rate of -0.003. The growth rate of the strain without reduction was of 0.33 (1/h) in minimal medium condition and 0.25 (1/h) under rich medium condition. The reduced strain obtained at the end of the simulation had respectively a growth rate of 0.54 (1/h) and 0.61 (1/h), so fully in the range of detection of our chemostat selection mechanism. References(1) "Thirteen Years of Building Constraint-Based In Silico Models of Escherichia coli" ,Jennifer L. Reed and Bernhard Ø. Palsson, Journal of Bacteriology, May 2003, p. 2692-2699, Vol. 185, No. 9 |
 "
"
