Team:Paris/Modeling/Score function
From 2008.igem.org
| (10 intermediate revisions not shown) | |||
| Line 4: | Line 4: | ||
|style="background:#ffffff"| | |style="background:#ffffff"| | ||
| - | == Types of | + | __TOC__ |
| + | |||
| + | == Types of output obtained == | ||
| + | |||
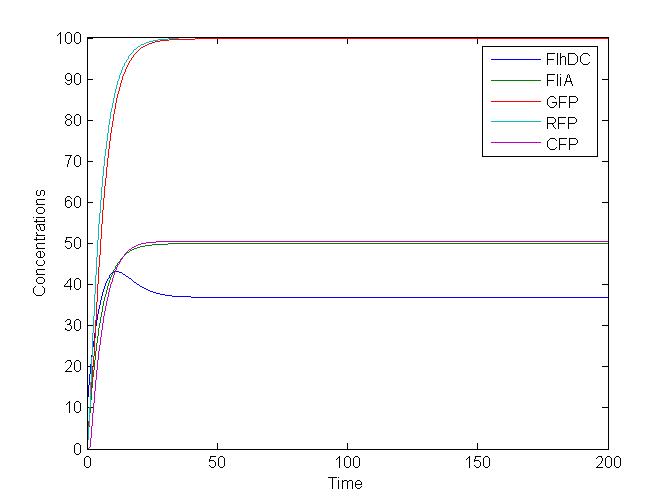
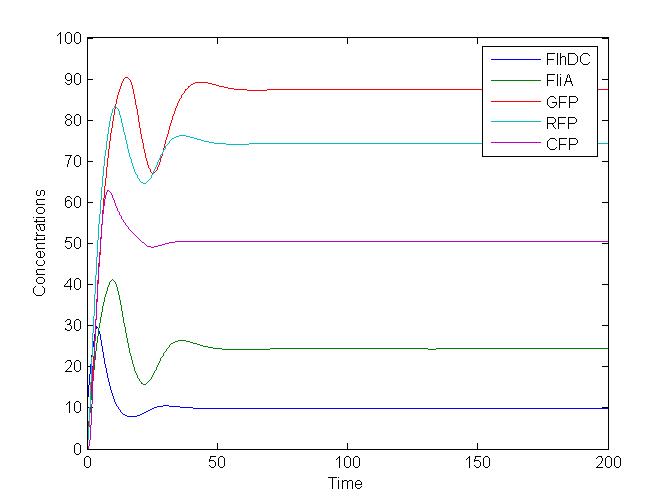
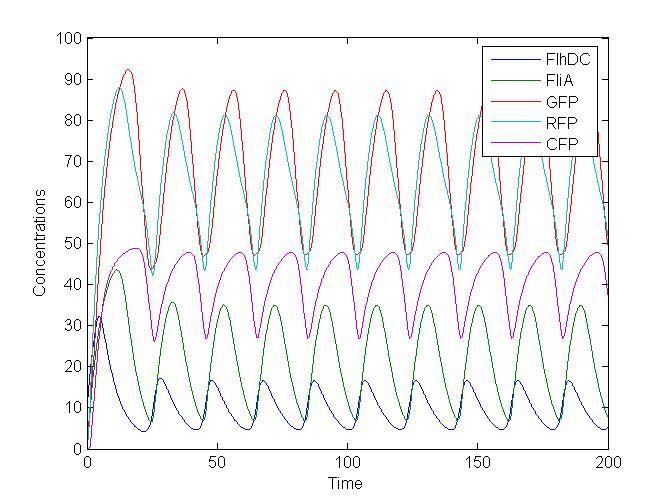
| + | Here are the kind of output we can obtain from our ode system. A score function will aim at ranking properly those outputs, from low score for 'no oscillations' to high score for 'oscillations'. | ||
| + | |||
| + | === No oscillations === | ||
| + | [[Image:no_oscill.jpg|center]] | ||
| + | |||
| + | === 'Almost' oscillations === | ||
| + | [[Image:debut_osc.jpg|center]] | ||
| + | |||
| + | === Oscillations === | ||
| + | [[Image:oscill.jpg|center]] | ||
| + | |||
| + | Of course, there are other behaviours that have been observed but this section was just a broad overview of the objects we are going to deal with. | ||
| + | |||
| + | == Score Function == | ||
| + | |||
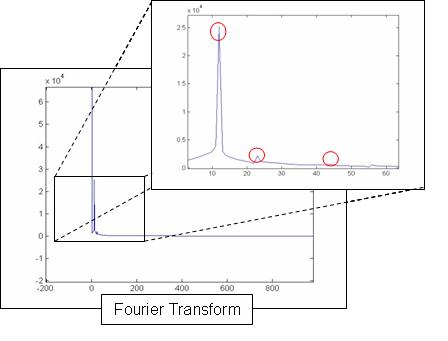
| + | The idea of the score function we have used is based on the Fourier Transform of the signals. Basically, it automatically detects a potential frequency and, then, estimate the relative 'weight' of this frequency and all its multiples. | ||
| + | |||
| + | [[Image:Score_function.JPG|center]] | ||
| + | |||
| + | Of course, we have had to get rid of the average value, in order to detect only the interesting peaks (zoomed picture presented above). Then, we sum all their intensities and normalize by the overall weigth. This provides a first criteria that we will certainely refine or even compare with other ones. | ||
| + | |||
| + | As a first try, the results are quite good as the function is able to rank properly the previously shown curves. | ||
| + | |||
| + | == Corresponding code == | ||
| + | |||
| + | The commented Matlab code can be found here : [[Team:Paris/Modeling/Critere|Criteria]] | ||
| + | |||
|}<br style="clear:both" /> | |}<br style="clear:both" /> | ||
Latest revision as of 14:33, 1 August 2008
|
 "
"


