Team:Purdue/Modeling
From 2008.igem.org
| (7 intermediate revisions not shown) | |||
| Line 14: | Line 14: | ||
#1997. "Mathematical model of the SOS response regulation of an excision repair deficient mutant of ''Escherichia coli'' after UV light irradation". [http://www2.lib.purdue.edu:2184/science?_ob=ArticleURL&_udi=B6WMD-45KKS62-5S&_user=29441&_coverDate=05%2F21%2F1997&_rdoc=1&_fmt=&_orig=search&_sort=d&view=c&_version=1&_urlVersion=0&_userid=29441&md5=7297869ffc31d1edfcd20856301793a5]. Off-the-shelf mechanistic model of the SOS response. Utilized as the basic model for our system. | #1997. "Mathematical model of the SOS response regulation of an excision repair deficient mutant of ''Escherichia coli'' after UV light irradation". [http://www2.lib.purdue.edu:2184/science?_ob=ArticleURL&_udi=B6WMD-45KKS62-5S&_user=29441&_coverDate=05%2F21%2F1997&_rdoc=1&_fmt=&_orig=search&_sort=d&view=c&_version=1&_urlVersion=0&_userid=29441&md5=7297869ffc31d1edfcd20856301793a5]. Off-the-shelf mechanistic model of the SOS response. Utilized as the basic model for our system. | ||
#2005. "Response times and mechanisms of SOS induction by attaching promoters to GFP: "Precise Temporal Modulation in the Response of the SOS DNA Repair Network in Individual Bacteria" [http://www.pubmedcentral.nih.gov/articlerender.fcgi?artid=1151601]. Potential Validation Data Set. Model should predict similar dynamics. | #2005. "Response times and mechanisms of SOS induction by attaching promoters to GFP: "Precise Temporal Modulation in the Response of the SOS DNA Repair Network in Individual Bacteria" [http://www.pubmedcentral.nih.gov/articlerender.fcgi?artid=1151601]. Potential Validation Data Set. Model should predict similar dynamics. | ||
| + | #Bachmair, A., D. Finley, et al. (1986). "INVIVO HALF-LIFE OF A PROTEIN IS A FUNCTION OF ITS AMINO-TERMINAL RESIDUE." Science 234(4773): 179-186. | ||
| + | #Hustad, G. O., Richards.T, et al. (1973). "IMMOBILIZATION OF BETA-GALACTOSIDASE ON AN INSOLUBLE CARRIER WITH A POLYISOCYANATE POLYMER .2. KINETICS AND STABILITY." Journal of Dairy Science 56(9): 1118-1122. | ||
| + | #Sharp, A. K., G. Kay, et al. (1969). "KINETICS OF BETA-GALACTOSIDASE ATTACHED TO POROUS CELLULOSE SHEETS." Biotechnology and Bioengineering 11(3): 363-&. | ||
| + | #Berg, J. T., JL. Stryer, L. (2006). Biochemistry. New York, NY, W.H. Freeman and Company. | ||
| + | |||
| Line 65: | Line 70: | ||
# The initial concentration of X-gal in the cell is: 7.48*10^(-16) moles. | # The initial concentration of X-gal in the cell is: 7.48*10^(-16) moles. | ||
# Half-life of beta-gal is 60 minutes. After the half-life, the enzyme no longer functions properly and is recycled. (Bachmair et al. 1986). | # Half-life of beta-gal is 60 minutes. After the half-life, the enzyme no longer functions properly and is recycled. (Bachmair et al. 1986). | ||
| + | # The uninduced level of beta-galactosidase in the cell is 10 molecules. (Stryer, 2006). | ||
'''Schemes for the different models''' | '''Schemes for the different models''' | ||
| Line 73: | Line 79: | ||
# The cleavage of X-gal is as follows: Rate of X-gal Cleavage*number of enzyme molecules*time / Initial X-gal cleavage. This gives us a percentage which is easier to represent and analyze visually. | # The cleavage of X-gal is as follows: Rate of X-gal Cleavage*number of enzyme molecules*time / Initial X-gal cleavage. This gives us a percentage which is easier to represent and analyze visually. | ||
# There are three different rates of formation of the enzyme. Data could not be found for the rate of formation, so different values were utilized. | # There are three different rates of formation of the enzyme. Data could not be found for the rate of formation, so different values were utilized. | ||
| + | # The enzymes do not act cooperatively. This means that when one enzyme is formed, it does NOT speed up the reaction of the other enzymes around. This causes a large time lag. A model assuming cooperativeness is shown below. | ||
| + | |||
{|align="justify" | {|align="justify" | ||
| Line 91: | Line 99: | ||
|} | |} | ||
| + | {|align="justify" | ||
| + | |[[Image:X_gal_cleave_8_5_min_coop.jpg|10px|center|frame]] | ||
| + | This image shows the time it takes to complete cleave the X-Gal in the cell when a new beta-galactosidase molecule is synthesized every 3 seconds and acts cooperatively. | ||
| + | |- | ||
| + | |} | ||
| + | |||
| + | ''All calculations were done in Microsoft Excel with basic algebraic manipulations and convolution principles by Craig Barcus.'' | ||
| + | |||
| + | ==Important Note on the above Beta-galactosidase models== | ||
| + | |||
| + | The above models are innacurate. Upon further viewing of the model, an epiphany occurred (with a little help from Dr. Rickus). Since the concentration of the substrate (Xgal) is on the order of 2500 times more prevalent in the cell than the Km value, the reaction will proceed at Vmax. We know that Vmax is a function of Kcat and the concentration of enzyme. We make an assumption that the concentration of beta-gal molecules is equivalent to that of RecA* that was found in the SOS model. Using Avagadro's number and the fact that the dimensionless RecA* concentration can be converted to molar concentration by multiplying by the initial concentration of RecA. | ||
| + | |||
| + | We can then fit this data utilizing a cubic spline and utilize it in the model of Vmax. | ||
| + | |||
| + | We then use Runge-Kutta 4th order fixed step to find when the indigo concentration reaches 500 mM (the concentration of Xgal throughout the cell, assumed to be constant due to the large concentration on the plate). This happens at approximately 6 minutes after UV dosage. | ||
| + | |||
| + | {|align="justify" | ||
| + | |[[Image:Indigo_Concentration.png|10px|center|frame]] | ||
| + | This image shows the time it takes to complete cleave the initial amount of Xgal in the cell (500mM). We see that as the pathway of SOS continues to function, more and more beta-gal (RecA*) gets produced and the rate of Xgal cleavage continues to go up exponentially. | ||
| + | |- | ||
| + | |} | ||
| + | |||
| + | ''Calculations were performed in MathCad, numerical data was exported to Excel and graphed for the plots above.'' | ||
| + | |||
| + | ==Governing Rate Equations== | ||
| + | |||
| + | The governing rate equations can be viewed in both the presentation and posters on the project page. | ||
<!--- The Mission, Experiments ---> | <!--- The Mission, Experiments ---> | ||
Latest revision as of 02:16, 30 October 2008
Contents |
Modeling Objectives
- Develop a mechanistics ODE model of the population to predict gene expression dynamics
- Question? .... Will the color production be fast enough to be useful to the user? Or will it be too late?
- What is the relationship between UV exposure and reporter gene expression?
- Can we construct a useful calibration curve of color as a function of UV?
Modeling References
- 1997. "Mathematical model of the SOS response regulation of an excision repair deficient mutant of Escherichia coli after UV light irradation". [http://www2.lib.purdue.edu:2184/science?_ob=ArticleURL&_udi=B6WMD-45KKS62-5S&_user=29441&_coverDate=05%2F21%2F1997&_rdoc=1&_fmt=&_orig=search&_sort=d&view=c&_version=1&_urlVersion=0&_userid=29441&md5=7297869ffc31d1edfcd20856301793a5]. Off-the-shelf mechanistic model of the SOS response. Utilized as the basic model for our system.
- 2005. "Response times and mechanisms of SOS induction by attaching promoters to GFP: "Precise Temporal Modulation in the Response of the SOS DNA Repair Network in Individual Bacteria" [http://www.pubmedcentral.nih.gov/articlerender.fcgi?artid=1151601]. Potential Validation Data Set. Model should predict similar dynamics.
- Bachmair, A., D. Finley, et al. (1986). "INVIVO HALF-LIFE OF A PROTEIN IS A FUNCTION OF ITS AMINO-TERMINAL RESIDUE." Science 234(4773): 179-186.
- Hustad, G. O., Richards.T, et al. (1973). "IMMOBILIZATION OF BETA-GALACTOSIDASE ON AN INSOLUBLE CARRIER WITH A POLYISOCYANATE POLYMER .2. KINETICS AND STABILITY." Journal of Dairy Science 56(9): 1118-1122.
- Sharp, A. K., G. Kay, et al. (1969). "KINETICS OF BETA-GALACTOSIDASE ATTACHED TO POROUS CELLULOSE SHEETS." Biotechnology and Bioengineering 11(3): 363-&.
- Berg, J. T., JL. Stryer, L. (2006). Biochemistry. New York, NY, W.H. Freeman and Company.
Modeling the SOS response in a uvr- mutant (No nucleotide excision repair)
Assumptions
- The UV light intensity is constant and instantaneous.
- The bacteria are not undergoing any type of DNA repair at the time of UV exposure.
- Thymine dimer formation is the major DNA damage occurring.
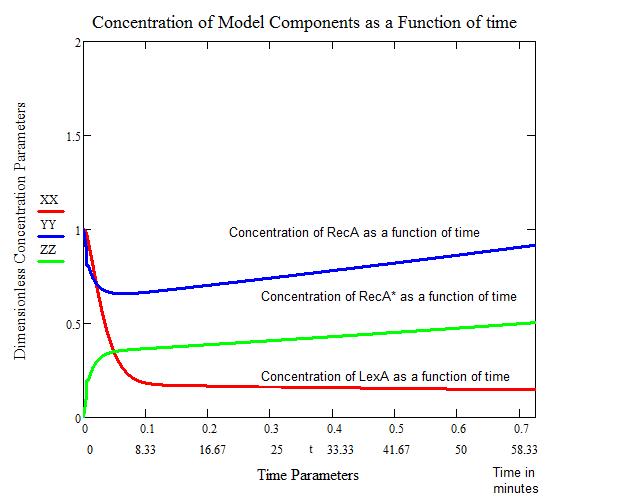
The first figure below shows the response to a 5 J/m^2 UV irradiation. We see that the concentration of bound LexA drops considerably within the first four minutes. This also correlates with the concentration of activated RecA (RecA*) going up appreciably. After approximately 60 minutes, the concentration of RecA returns to a normal level. We therefore consider this the "stopping" point of SOS.
The problems with this model include:
- The model is based on an instantaneous irradiation of UV at 5 J/m^2.
- The model does not account for continuous UV exposure.
- The model does not account for any other proteins/genes that may be involved in SOS (ie. SulA).
The benefits of this model include:
- Giving us a mathematical, manipulateable model to mend for our purposes.
- Showing the general trend of how SOS behaves.
- Gives us a time frame for how our color reporters need to work to be feasible.
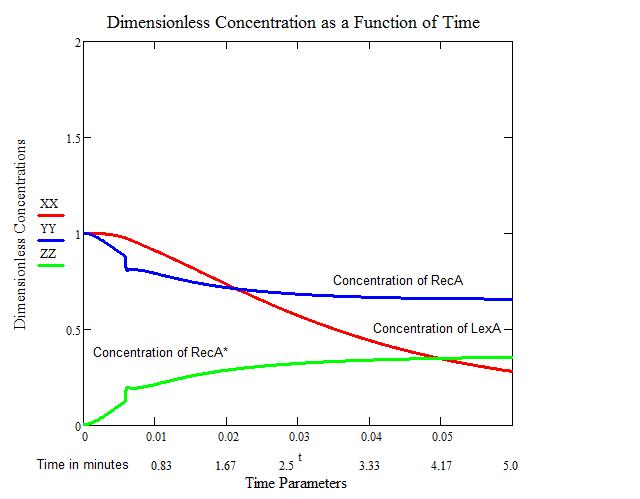
The second figure provides us with a close-up view of the increase in RecA* and decreases of LexA and RecA. We see that an artifact occurs around the 30 second mark. This artifact is related to the step-wise function that occurs in the model. Over the larger time frame, this artifact is negligible.
Since we have no quantitative data on the activation and deactivation of SOS, we must make an assumption as to when SOS truly starts to take effect. We will consider the intersection of LexA and RecA* to be the initial time when SOS can start repairing the damage accrued by UV irradiation.
All Calculations and the figures above were performed in MathCad, utilizing built in Runge-Kutta 4th order function, by Craig Barcus, utilizing the mathematical model presented by SV. Aksenov in 1997.
Modeling the cleavage of X-gal by Beta-galactosidase
Assumptions
- The bacteria have been on the X-gal plate sufficiently long for the X-gal to be in equilibrium with the surface and the cell. This means that the cell has the same concentration of X-gal within its cell wall as the surface outside.
- There is no diffusion limitation with this system. As soon as an enzyme is produced, it immediately can bind and cleave X-gal.
- The enzymes follow a Michaelis-Menten type enzymatic reaction. Km for this system is 0.2 mM and Vm was calculated to be 4.826 M/min. (Sharp et al. 1969).
- Kcat was calculated at 1.52*10^(-20) moles X-Gal / molecule beta-Gal*min. This is the rate of X-gal Cleava
- The initial concentration of X-gal in the cell is: 7.48*10^(-16) moles.
- Half-life of beta-gal is 60 minutes. After the half-life, the enzyme no longer functions properly and is recycled. (Bachmair et al. 1986).
- The uninduced level of beta-galactosidase in the cell is 10 molecules. (Stryer, 2006).
Schemes for the different models
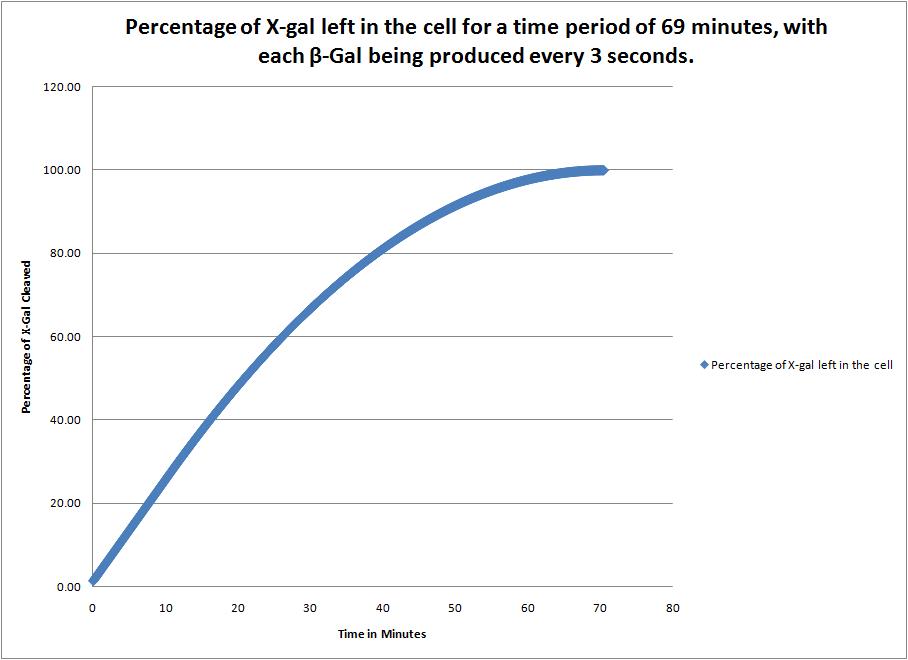
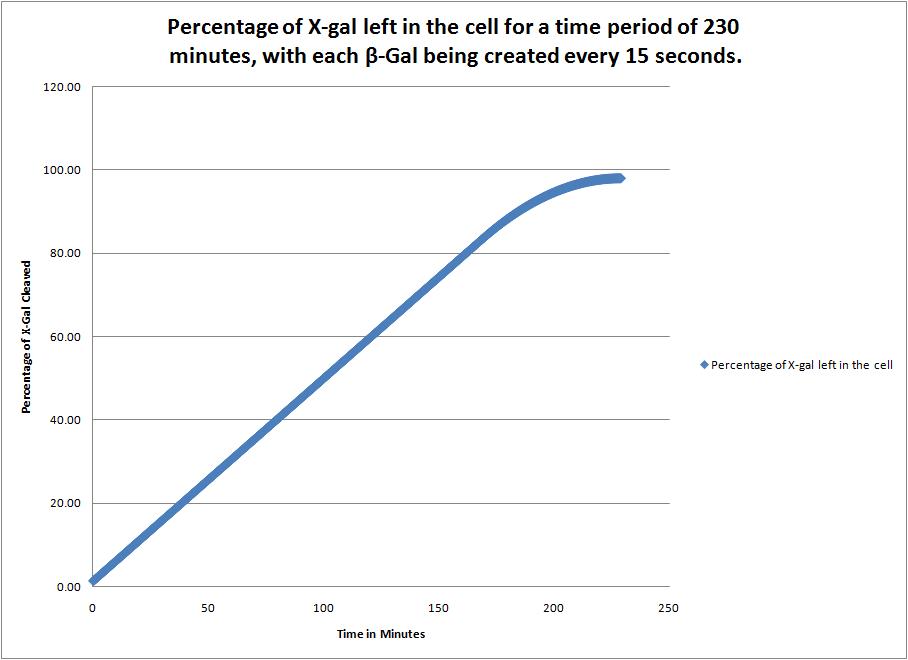
For the three graphs below, the following scheme was utilized in Microsoft Excel:
- The enzyme will only function for 60 minutes, therefore, any complete cleavage time over 60 minutes requires that the enzymes acting for the first 60 minutes of their life will not act after that.
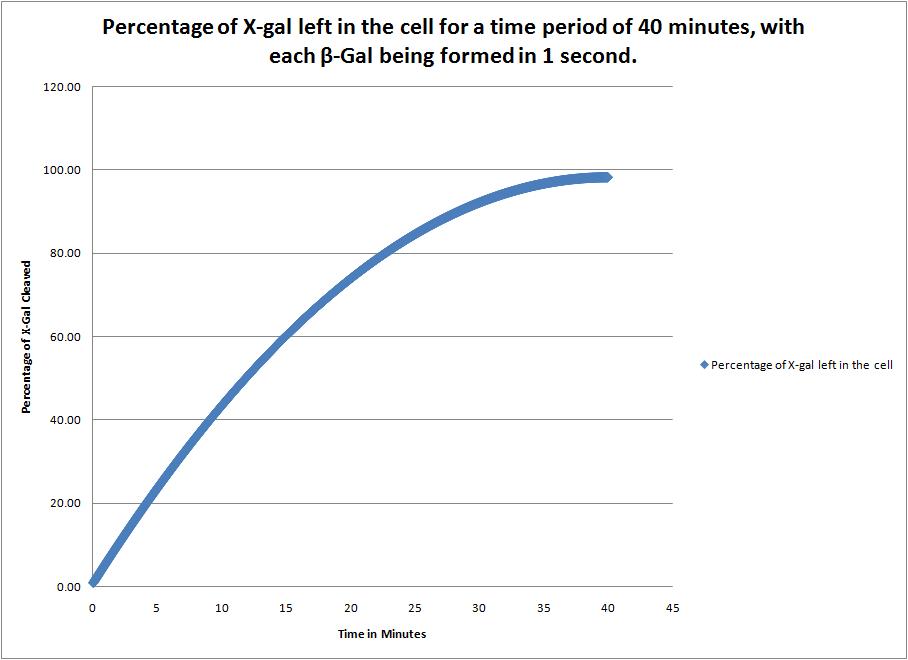
- The cleavage of X-gal is as follows: Rate of X-gal Cleavage*number of enzyme molecules*time / Initial X-gal cleavage. This gives us a percentage which is easier to represent and analyze visually.
- There are three different rates of formation of the enzyme. Data could not be found for the rate of formation, so different values were utilized.
- The enzymes do not act cooperatively. This means that when one enzyme is formed, it does NOT speed up the reaction of the other enzymes around. This causes a large time lag. A model assuming cooperativeness is shown below.
|
This image shows the time it takes to complete cleave the X-Gal in the cell when a new beta-galactosidase molecule is synthesized every 1 second. |
|
This image shows the time it takes to complete cleave the X-Gal in the cell when a new beta-galactosidase molecule is synthesized every 3 seconds. |
|
This image shows the time it takes to complete cleave the X-Gal in the cell when a new beta-galactosidase molecule is synthesized every 15 seconds. |
|
This image shows the time it takes to complete cleave the X-Gal in the cell when a new beta-galactosidase molecule is synthesized every 3 seconds and acts cooperatively. |
All calculations were done in Microsoft Excel with basic algebraic manipulations and convolution principles by Craig Barcus.
Important Note on the above Beta-galactosidase models
The above models are innacurate. Upon further viewing of the model, an epiphany occurred (with a little help from Dr. Rickus). Since the concentration of the substrate (Xgal) is on the order of 2500 times more prevalent in the cell than the Km value, the reaction will proceed at Vmax. We know that Vmax is a function of Kcat and the concentration of enzyme. We make an assumption that the concentration of beta-gal molecules is equivalent to that of RecA* that was found in the SOS model. Using Avagadro's number and the fact that the dimensionless RecA* concentration can be converted to molar concentration by multiplying by the initial concentration of RecA.
We can then fit this data utilizing a cubic spline and utilize it in the model of Vmax.
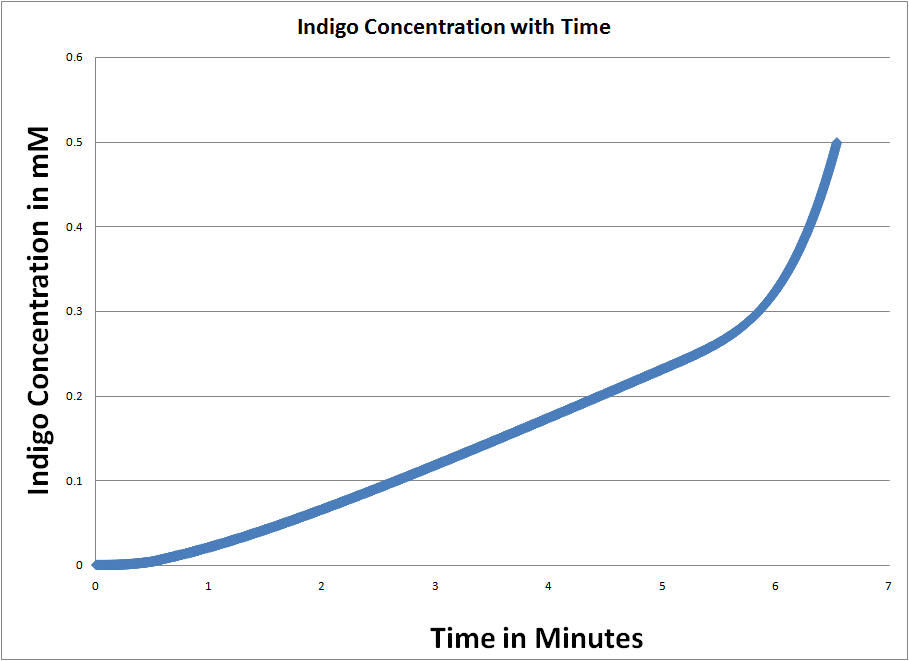
We then use Runge-Kutta 4th order fixed step to find when the indigo concentration reaches 500 mM (the concentration of Xgal throughout the cell, assumed to be constant due to the large concentration on the plate). This happens at approximately 6 minutes after UV dosage.
|
This image shows the time it takes to complete cleave the initial amount of Xgal in the cell (500mM). We see that as the pathway of SOS continues to function, more and more beta-gal (RecA*) gets produced and the rate of Xgal cleavage continues to go up exponentially. |
Calculations were performed in MathCad, numerical data was exported to Excel and graphed for the plots above.
Governing Rate Equations
The governing rate equations can be viewed in both the presentation and posters on the project page.
| Home | The Team | The Project | Parts Submitted to the Registry | Modeling | Notebook | Tools and References |
|---|
 "
"
