Team:University of Washington/Measurement Kit
From 2008.igem.org
(→Measurement Kit) |
|||
| (6 intermediate revisions not shown) | |||
| Line 36: | Line 36: | ||
!align="center"; style="border: #6b0c6a outset 3px;" |[[Team:University_of_Washington/Safety|<font color="gold">Safety</font>]] | !align="center"; style="border: #6b0c6a outset 3px;" |[[Team:University_of_Washington/Safety|<font color="gold">Safety</font>]] | ||
|} | |} | ||
| + | |||
| + | =Measurement Kit= | ||
| + | |||
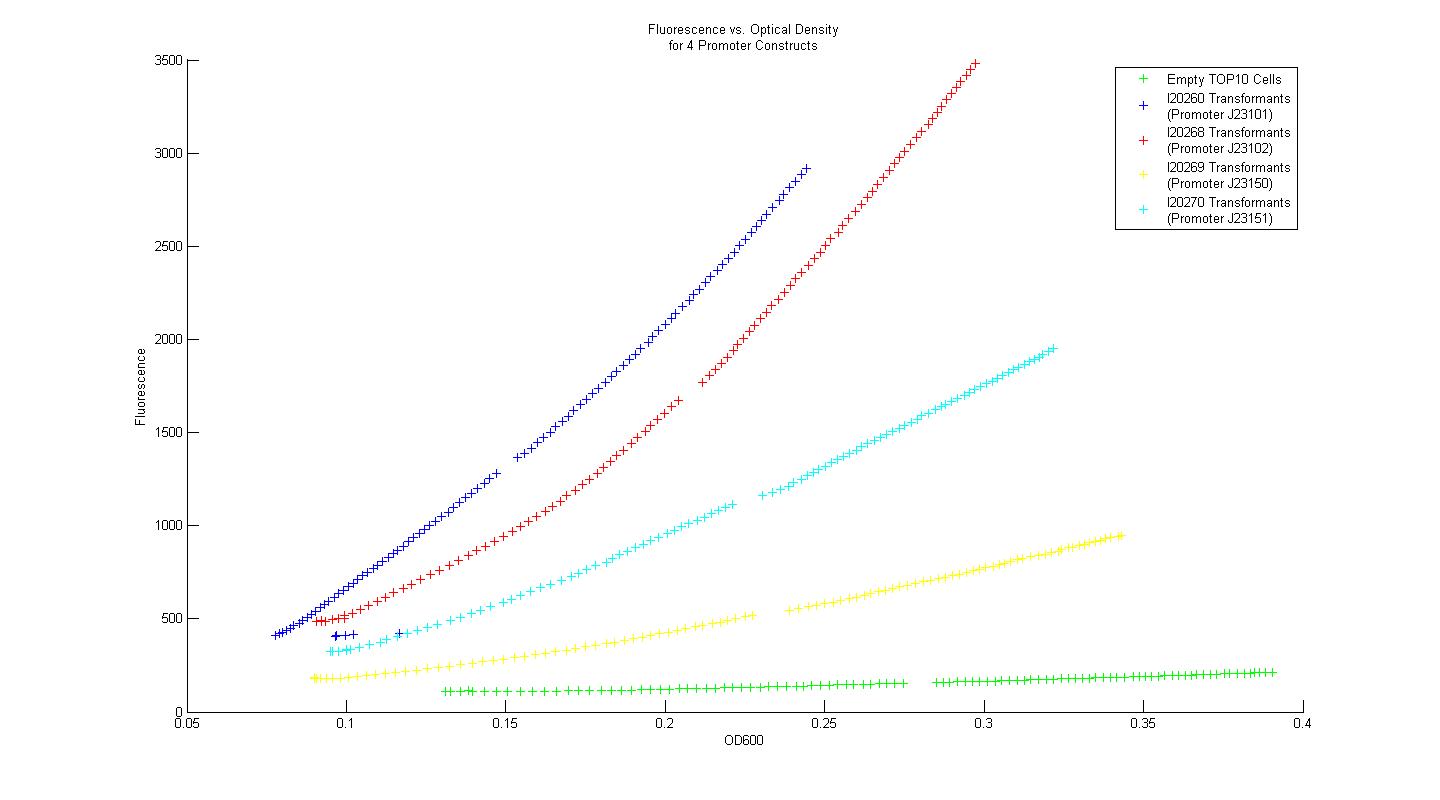
| + | In order to determine whether our measurement protocols, equipment, and materials would allow us to quantify and compare our own parts and devices, the Measurement Kit included with the 2008 iGEM parts distribution was used. Four constitutive promoter constructs, consisting of a variant promoter, followed by a standard ribosome binding site, GFP reporter gene, and terminator were transformed into chemically competent TOP10 ''E. coli'' cells. Three single colony isolates for each promoter construct transformant (along with three control colony isolates lacking the promoter construct plasmid) were grown overnight in M9 minimal media with kanamycin at 37 C. After 16 hours, each overnight culture was diluted 100 fold into fresh M9 media with kanamycin, and grown for 3 hours. After three hours, two 200uL samples from each of the overnight cultures were placed in individual wells of a 96-well plate, and 50 uL of mineral oil was added on top of each sample to prevent dehydration. Data for fluorescence and absorbance were taken for each well every five minutes for eight hours. The plate-reader temperature was set to 37 degrees at the outset, and 15 second linear shake steps were included between reads. The time course data for fluorescence and absorbance were averaged across all six samples that corresponded to a single promoter construct. Plots of fluorescence versus absorbance were made in MATLAB, and the resultant figure is displayed below. | ||
| + | |||
| + | [[Image:Promoter_Measurements.jpg|center|900px]] | ||
| + | |||
| + | Using the Measurement Kit method for determining relative promoter strength, the rank order of the promoters is identical to that provided in the Kit data. Additionally, when the strengths of the promoters were normalized by the empty control group, then scaled again so that promoter I20260 had a strength equal to unity, the quantified relative strengths compare nicely to the numerical values provided in the Measurement Kit. In this way, we concluded that our measurement techniques were sound, and that they could be applied to measurement of genetic constructs relevant to our primary project. | ||
Latest revision as of 04:09, 30 October 2008

| Home | The Team | The Project | Modeling | Notebook | Protocols | Parts Submitted to the Registry | Measurement Kit | SeToB | Safety |
|---|
Measurement Kit
In order to determine whether our measurement protocols, equipment, and materials would allow us to quantify and compare our own parts and devices, the Measurement Kit included with the 2008 iGEM parts distribution was used. Four constitutive promoter constructs, consisting of a variant promoter, followed by a standard ribosome binding site, GFP reporter gene, and terminator were transformed into chemically competent TOP10 E. coli cells. Three single colony isolates for each promoter construct transformant (along with three control colony isolates lacking the promoter construct plasmid) were grown overnight in M9 minimal media with kanamycin at 37 C. After 16 hours, each overnight culture was diluted 100 fold into fresh M9 media with kanamycin, and grown for 3 hours. After three hours, two 200uL samples from each of the overnight cultures were placed in individual wells of a 96-well plate, and 50 uL of mineral oil was added on top of each sample to prevent dehydration. Data for fluorescence and absorbance were taken for each well every five minutes for eight hours. The plate-reader temperature was set to 37 degrees at the outset, and 15 second linear shake steps were included between reads. The time course data for fluorescence and absorbance were averaged across all six samples that corresponded to a single promoter construct. Plots of fluorescence versus absorbance were made in MATLAB, and the resultant figure is displayed below.
Using the Measurement Kit method for determining relative promoter strength, the rank order of the promoters is identical to that provided in the Kit data. Additionally, when the strengths of the promoters were normalized by the empty control group, then scaled again so that promoter I20260 had a strength equal to unity, the quantified relative strengths compare nicely to the numerical values provided in the Measurement Kit. In this way, we concluded that our measurement techniques were sound, and that they could be applied to measurement of genetic constructs relevant to our primary project.
 "
"
