Team:Valencia/Project/Modeling
From 2008.igem.org
(→Obtaining the parameters of the model for the different strains) |
(→Obtaining the parameters of the model for the different strains) |
||
| (37 intermediate revisions not shown) | |||
| Line 9: | Line 9: | ||
==Oxidative phosphorylation model coupled with thermogenine expression== | ==Oxidative phosphorylation model coupled with thermogenine expression== | ||
| - | Our project consists of implementing a controlled heating system inside ''Saccharomyces cerevisiae''. In order to obtain this we are going to use a mitocondrial | + | Our project consists of implementing a controlled heating system inside the yeast ''Saccharomyces cerevisiae''. In order to obtain this we are going to use a mitocondrial transmembrane protein known as thermogenin used by mammalian cells to increase their temperature. |
| - | The working principle of thermogenin is based on the respiratory chain. The way in which thermogenin increases the temperature of the system can be described approximately as follows: | + | The working principle of thermogenin is based on the respiratory chain. The way in which thermogenin increases the temperature of the system can be described approximately as follows: it produces a pinhole on the mitocondrial membrane which makes difficult the production of a proton gradient around this membrane. The release of the mitocondrial proton gradient increases the temperature. |
In order to describe the system three complementary models have been developed : | In order to describe the system three complementary models have been developed : | ||
| Line 26: | Line 26: | ||
In order to estimate the potential temperature increase produced by this organism we argue in the following way: | In order to estimate the potential temperature increase produced by this organism we argue in the following way: | ||
| - | *Glucose | + | *Glucose consumtion of a culture of our yeast is in the order of 1 g/h[[Team:Valencia/Project/Modeling#References | (Gonçalvez et al.) ]]. |
*Considering that each molecule of glucose could give us in the order of 30 ATP molecules in the respiratory transport chain. | *Considering that each molecule of glucose could give us in the order of 30 ATP molecules in the respiratory transport chain. | ||
| Line 36: | Line 36: | ||
From all these hypothesis we have a net energy production of the system of 5 J/s. | From all these hypothesis we have a net energy production of the system of 5 J/s. | ||
| - | If we apply this energy to our culture and we assume that our growth media is equivalent to water | + | If we apply this energy to our culture and we assume that our growth media is equivalent to water, we obtain that this energy will produce a temperature increase of 0.01 K/s. Therefore the increase of the tempeature in one hour can be of 30 degrees!!! |
Nevertheless, in this process several assumptions have been made that should be considered: | Nevertheless, in this process several assumptions have been made that should be considered: | ||
| Line 42: | Line 42: | ||
*There is no heat losses to the ambient. | *There is no heat losses to the ambient. | ||
| - | *Glucose is metabolized only | + | *Glucose is completely metabolized and its energy ends only at the respiratory transport. (This is not true as other pathways like fermentation are important). |
| - | * | + | *ATPase is completely inactive and all the proton gradient will be oriented at producing heat. (''In vivo'', we did not block this enzyme as the system requires ATP to grow). |
| - | *If | + | *If the temperature is increased too much probably the glucose uptake data and other estimations performed here will be not applicable and the heat production of the system will stop, or will reduce its performance. |
Even all these drawback in the heat production, as the system has a great potential of producing heat, we hope to be able to detect an effect of the UCP in the temperature of the system :-). | Even all these drawback in the heat production, as the system has a great potential of producing heat, we hope to be able to detect an effect of the UCP in the temperature of the system :-). | ||
==Black box model of temperature increase produced by thermogenin== | ==Black box model of temperature increase produced by thermogenin== | ||
| - | The black box model simulates the temperature evolution of the system as a function of the growth rate, galactose concentration and thermogenin expresion. We assume that our system can be | + | The black box model simulates the temperature evolution of the system as a function of the growth rate, galactose concentration and thermogenin expresion. We assume that our system can be described by the following system of equations: |
[[Image:Valencia_ec.JPG|300px]] | [[Image:Valencia_ec.JPG|300px]] | ||
| Line 57: | Line 57: | ||
where: | where: | ||
| - | * first equation: Growth of the culture: logistic growth of the different mutants used in our experiments | + | * first equation: Growth of the culture: logistic growth of the different mutants used in our experiments |
| - | * second equation: Galactose evolution | + | * second equation: Galactose evolution -Galactose is the metabolite which induces the thermogenin expresion |
| - | * third equation: Thermogenin concentration level | + | * third equation: Thermogenin concentration level |
| - | * | + | * fourth equation: Temperature evolution -the first term of the equation represents the calorimeter thermal losses to the environment and the second one the temperature increase as a consequence of the thermogenin expresion |
==Obtaining the parameters of the model for the different strains== | ==Obtaining the parameters of the model for the different strains== | ||
| Line 66: | Line 66: | ||
The determination of the parameters of the model will characterize the behaviour of the thermogenin. The characterization was performed in the following way: | The determination of the parameters of the model will characterize the behaviour of the thermogenin. The characterization was performed in the following way: | ||
| - | * The parameters of the growth | + | * The parameters of the growth equation were obtained from the characterization of the growth curve |
| - | * The parameter representing the heat losses of the calorimeter was fixed according the characterization with water | + | * The parameter representing the heat losses of the calorimeter was fixed according to the calorimeter experimental characterization with water |
| - | * The rest of the parameters were fitted according to the different experimental curves of temperature | + | * The rest of the parameters were fitted according to the different experimental curves of temperature against time |
<h3>Growth equation</h3> | <h3>Growth equation</h3> | ||
| - | To obtain the following data we grew all our strains inside the LCC at 270 r.p.m in | + | To obtain the following data we grew all our strains inside the LCC at 270 r.p.m in SP medium with galactose induction. We fitted the curves to the logistic growth equation using the non-linear curve fitting tool from OriginPro program. |
| Line 91: | Line 91: | ||
|} | |} | ||
| - | The fitting is statistically significant at the 5% level, with good R<sup>2</sup> , thus the logistic curve explains well the data | + | The fitting is statistically significant at the 5% level, with good R<sup>2</sup> , thus the logistic curve explains well the data. |
| - | + | The expression of natural ocurring UCP in the positive control affects slightly its growth in comparison with the negative control. On the other hand, both mutants were affected by the expression of highly functional UCP reducing their carrying capacity regarding the controls. More specifically, 175 deleted growth rate is slowed down, coherent with the glycine mutation that enhances UCP function. We conclude that the functional UCP is possitively expressed in the mutants and confirm that those mutants have an enhanced efficiency in comparison with the natural ocurring strain, UCP+. | |
| + | <h3>Calorimeter characterization curve</h3> | ||
The temperature equation has a heat loss term which follows Newton’s law of cooling. We adjusted the results from the LCC characterization in order to get the parameters for the loss term of the temperature evolution equation. Environment temperature remained constant at 22ºC. From the figure it is also tested that the behaviour of the four calorimeters are equivalent. | The temperature equation has a heat loss term which follows Newton’s law of cooling. We adjusted the results from the LCC characterization in order to get the parameters for the loss term of the temperature evolution equation. Environment temperature remained constant at 22ºC. From the figure it is also tested that the behaviour of the four calorimeters are equivalent. | ||
| Line 102: | Line 103: | ||
<h3>UCP expression</h3> | <h3>UCP expression</h3> | ||
| + | From a sample of 10 experiments in which the evolution of the temperature of the four strain was measured we performed a fit using Simulink software. In the figure there is a representative curve of the experiments. | ||
| - | + | [[Image:V_done24_9.jpg|300px]] | |
| - | [[Image: | + | From the 10 experiments we determined the values of the parameters β 1, α , K1 , β 2,n, γ , ξ . The final values of the parameters were promediated among all the set of experimental data in the following way: |
| + | |||
| + | * We assume that the difference between our mutants lays solely on their UCP expression equation parameters (α γ K); the mutants should have the same values for both 175 Δ and 76 Δ asthey use the same Gal promoter. | ||
| + | * The half life of the UCP mutant for the strains 175d and 76 should be similar (by the fit we confirmed that, as we feared that the mutant little deletions would affect protein stability). | ||
| + | * The Hill coefficient (n) was fixed (n=2) in order to reduce the solution space of the parameters. | ||
| + | * The constant β is specific of each strain. | ||
| + | * ε is specific of each strain. | ||
| + | |||
| + | According to this assumptions the obtained values for the characterization of the different strains were: | ||
| + | |||
| + | |||
| + | [[Image:V_Paraexpre2.jpg]] | ||
| + | |||
| + | UCP+ was excluded of the analysis as the results from the set of selected experiments were not clear, and the parameters fluctuated substantially among the experiments. | ||
| + | |||
| + | Analyzing the obtained values for the parameters we can conclude: | ||
| + | |||
| + | * 175 Δ has a higher thermal effect on the system. This result is in agreement with the growth curves in which this strain was the one showing a lower growth. Therefore, this UCP allows a higher flux of protons through the mitocondrial membrane increasing the heat production and reducing the ATP production compared to 76 Δ | ||
| + | |||
| + | * UCP protein has a quite long half life period | ||
| + | |||
| + | * UCP- does not show a significant heat production giving reliability to the obtained results and the followed methodology | ||
| + | |||
| + | * A future improvement of the fit can be performed developing an experimental evaluation of the Galactose consumed during the experiments. In such a way that we can obtain a reduction of the solution space parameters. | ||
| + | |||
| + | '''To see the graphical representation of the fit go [[Valencia/fit|here]]''' | ||
==Modeling the control system== | ==Modeling the control system== | ||
| - | Our device is able to increase the environment temperature. We would like to control the effect of our system so as to keep the | + | Our device is able to increase the environment temperature. We would like to control the effect of our system so as to keep the yeast broth in a desired temperature. With these features the final biological construction would resemble a heating system with a thermostat. |
| + | |||
| + | In order to achieve this we will need a way of sensing temperature. A possible suitable idea can be a system based on cold shock and heat shock proteins, in fact the iGEM project developed this year by [https://2008.igem.org/Team:TUDelft TU Delft] can be very inspiring if it is possible to implement something similar in yeast. Therefore, having promoters sensible to temperature give the sensing key for an activator or repressor of the UCP expression. By modifying the strength of the promoter of our constructions we will tune the setpoint temperature to the desired value. | ||
| + | |||
| + | We find two problems in order to implement the system: | ||
| + | |||
| + | * UCP has a high half life time period, this means that our activation/repression control strategy would have a quite delicated problem, mainly because of the lag between the sensing and the effect of the fully functional UCP. | ||
| + | * Cold shock and heat shock proteins found in literature have a range which is between 5-10 K higher or lower than the desired ones (heat shock proteins appears mostly at 37ºC and cold shock proteins appears from 15ºC). | ||
==Modeling the oxidative phosphorylation pathway== | ==Modeling the oxidative phosphorylation pathway== | ||
| Line 188: | Line 222: | ||
The model of this complex is under development. | The model of this complex is under development. | ||
| - | ''' | + | ''Hélas'' we did not have time to finish this detailed model of the effect of UCP on mitochondrial bioenergetics. Anyway, we still had fun with everything we lived this last summer! |
| + | '''TOO SHORT SUMMER OR TOO AMBITIOUS STUDENTS FOR SUCH KIND OF MODELING!!!''' | ||
==References== | ==References== | ||
Latest revision as of 01:04, 30 October 2008
Oxidative phosphorylation model coupled with thermogenine expression
Our project consists of implementing a controlled heating system inside the yeast Saccharomyces cerevisiae. In order to obtain this we are going to use a mitocondrial transmembrane protein known as thermogenin used by mammalian cells to increase their temperature.
The working principle of thermogenin is based on the respiratory chain. The way in which thermogenin increases the temperature of the system can be described approximately as follows: it produces a pinhole on the mitocondrial membrane which makes difficult the production of a proton gradient around this membrane. The release of the mitocondrial proton gradient increases the temperature.
In order to describe the system three complementary models have been developed :
- Black box model of the temperature increase by the thermogenin.
- Detailed model of the respiratory electron transport chain.
- Regulatory model of the thermogenin expresion.
Theoretical evaluation of the idea
To evaluate the reliability of the idea we are going to estimate the maximal attainable temperature (obviously, the minimal temperature value is the corresponding to the culture conditions). This means to estimate the maximum heat production. The maximal temperature can be determined by supposing that the proton motive force is used solely in heat production mediated by thermogenine. The following calculations were made taking into account this assumption.
In order to estimate the potential temperature increase produced by this organism we argue in the following way:
- Glucose consumtion of a culture of our yeast is in the order of 1 g/h (Gonçalvez et al.) .
- Considering that each molecule of glucose could give us in the order of 30 ATP molecules in the respiratory transport chain.
- Taking into account that each molecule of ATP generated throught ATPase requires about 4 protons.
- Assuming that the free energy associated to a single proton being dissipated through the ATPase is 20 Kj/mol.
From all these hypothesis we have a net energy production of the system of 5 J/s.
If we apply this energy to our culture and we assume that our growth media is equivalent to water, we obtain that this energy will produce a temperature increase of 0.01 K/s. Therefore the increase of the tempeature in one hour can be of 30 degrees!!!
Nevertheless, in this process several assumptions have been made that should be considered:
- There is no heat losses to the ambient.
- Glucose is completely metabolized and its energy ends only at the respiratory transport. (This is not true as other pathways like fermentation are important).
- ATPase is completely inactive and all the proton gradient will be oriented at producing heat. (In vivo, we did not block this enzyme as the system requires ATP to grow).
- If the temperature is increased too much probably the glucose uptake data and other estimations performed here will be not applicable and the heat production of the system will stop, or will reduce its performance.
Even all these drawback in the heat production, as the system has a great potential of producing heat, we hope to be able to detect an effect of the UCP in the temperature of the system :-).
Black box model of temperature increase produced by thermogenin
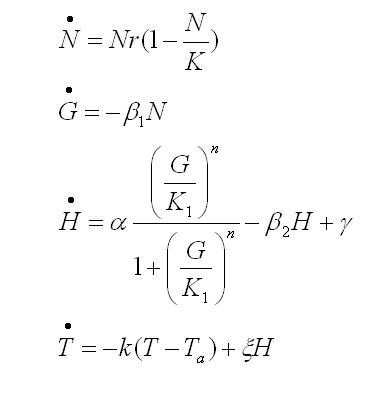
The black box model simulates the temperature evolution of the system as a function of the growth rate, galactose concentration and thermogenin expresion. We assume that our system can be described by the following system of equations:
where:
- first equation: Growth of the culture: logistic growth of the different mutants used in our experiments
- second equation: Galactose evolution -Galactose is the metabolite which induces the thermogenin expresion
- third equation: Thermogenin concentration level
- fourth equation: Temperature evolution -the first term of the equation represents the calorimeter thermal losses to the environment and the second one the temperature increase as a consequence of the thermogenin expresion
Obtaining the parameters of the model for the different strains
The determination of the parameters of the model will characterize the behaviour of the thermogenin. The characterization was performed in the following way:
- The parameters of the growth equation were obtained from the characterization of the growth curve
- The parameter representing the heat losses of the calorimeter was fixed according to the calorimeter experimental characterization with water
- The rest of the parameters were fitted according to the different experimental curves of temperature against time
Growth equation
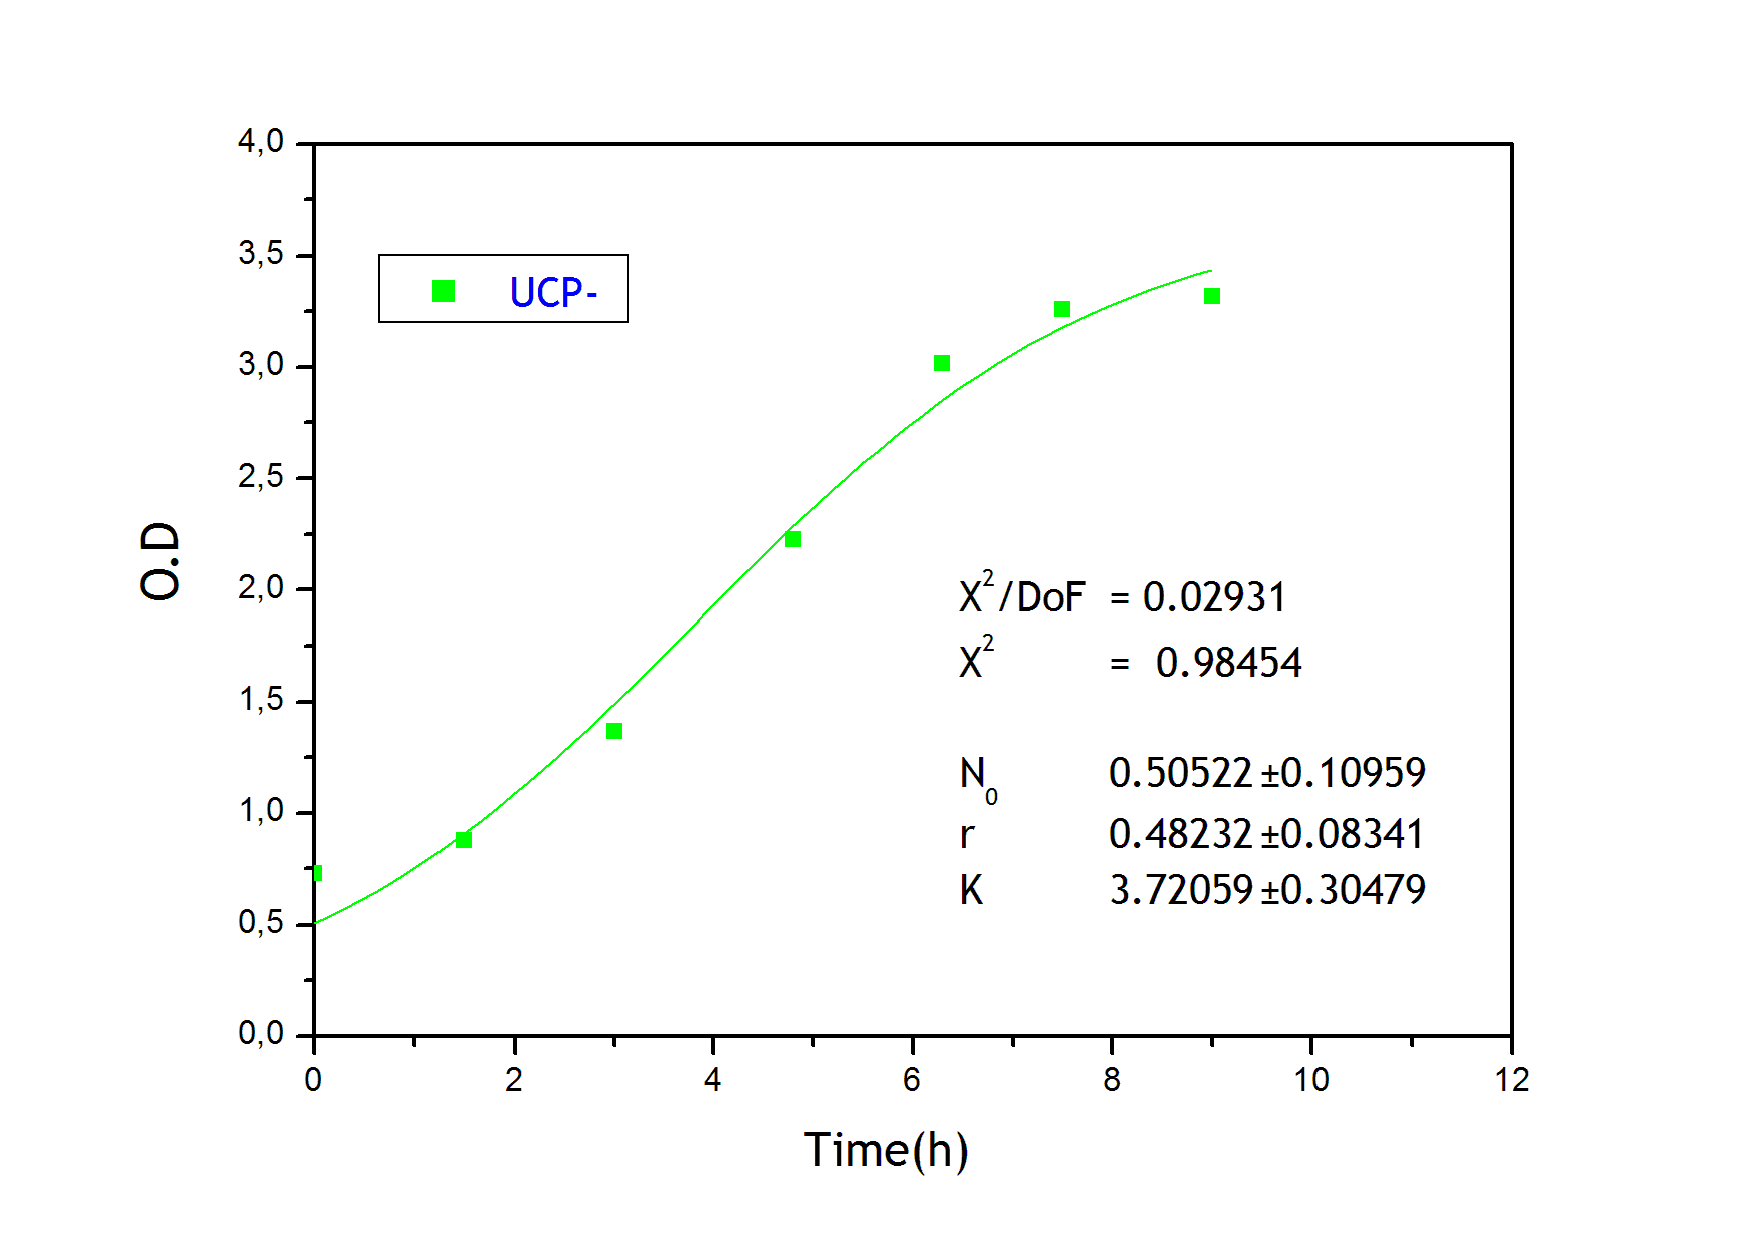
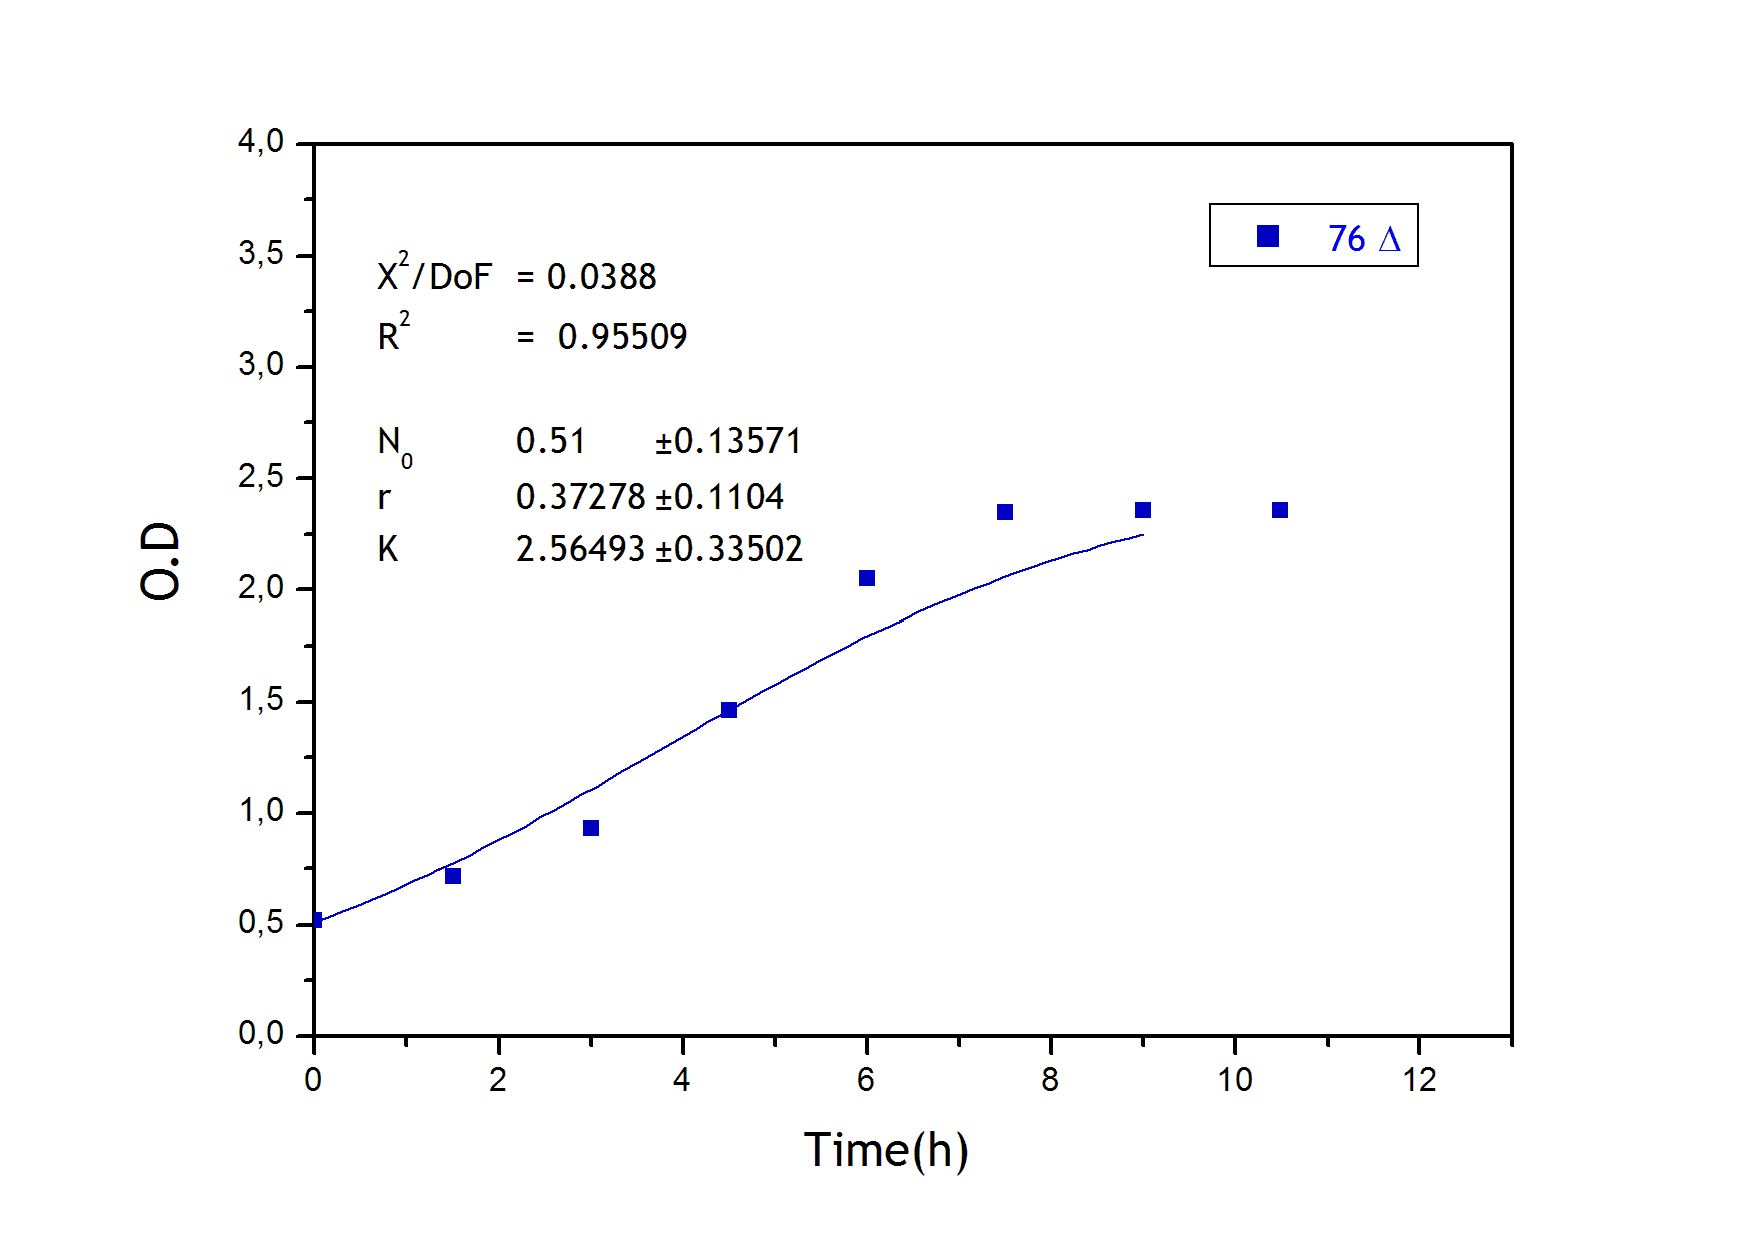
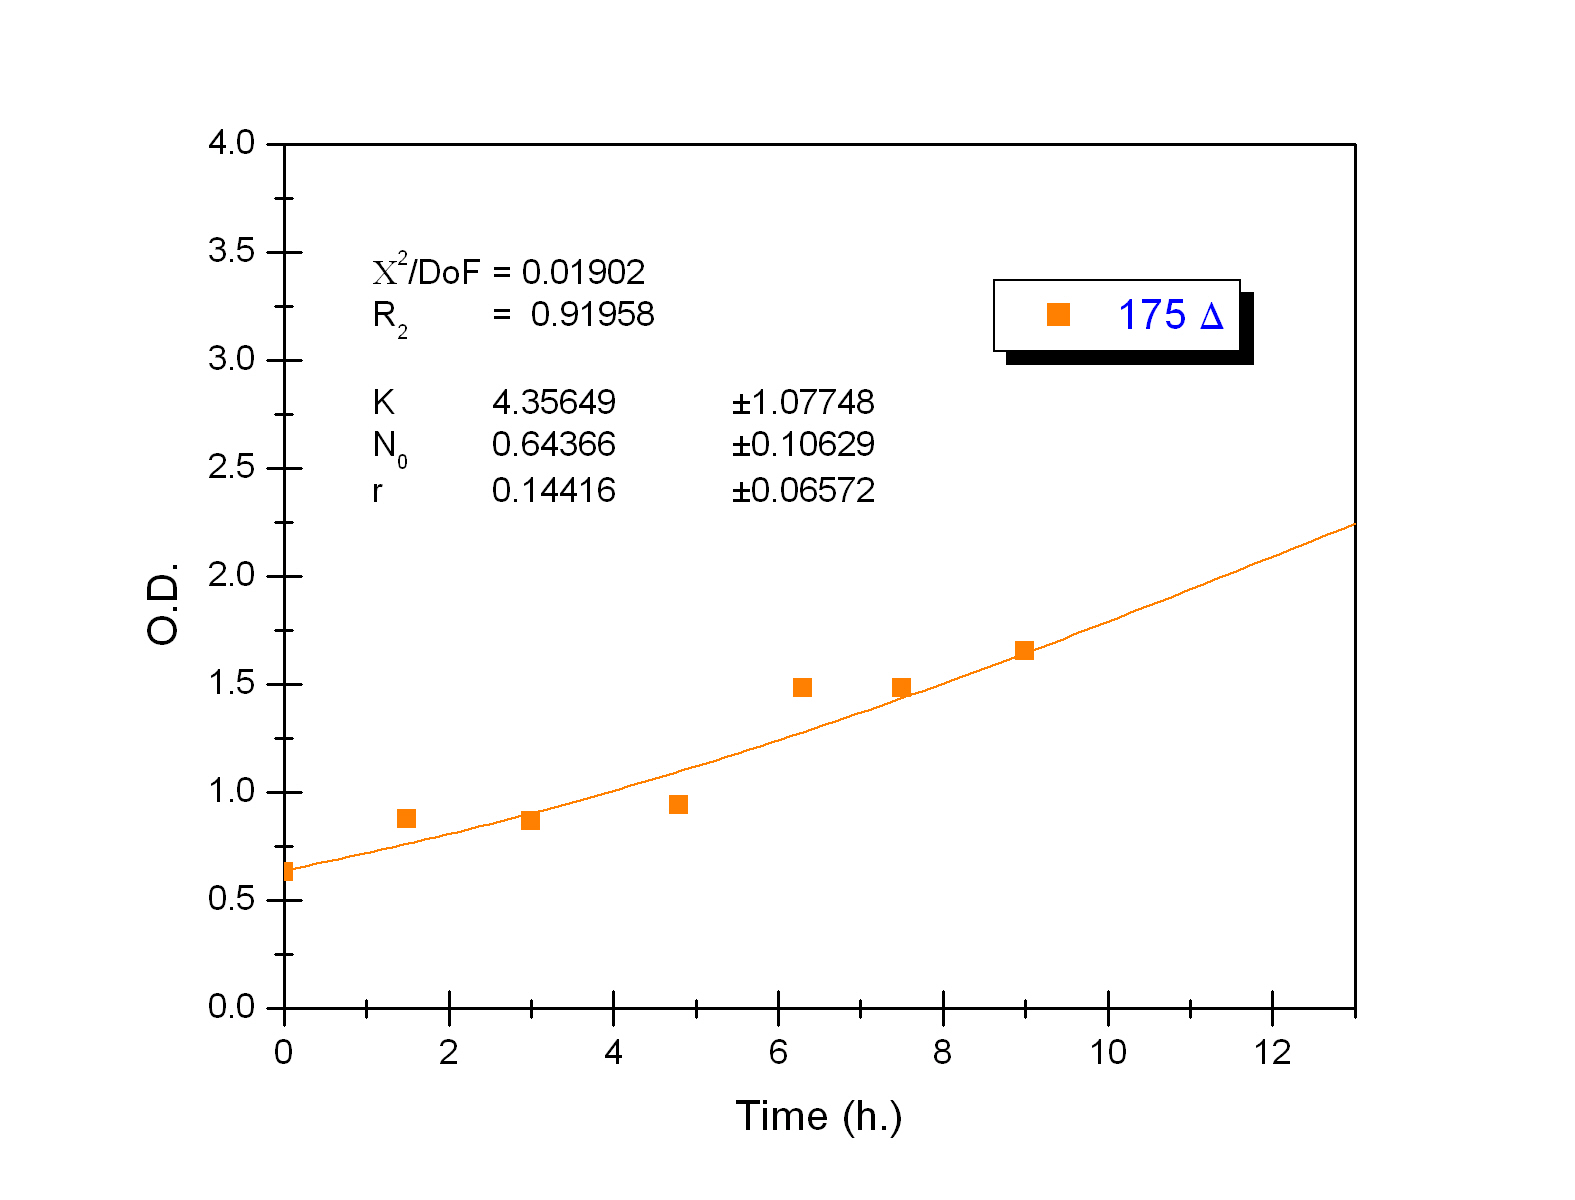
To obtain the following data we grew all our strains inside the LCC at 270 r.p.m in SP medium with galactose induction. We fitted the curves to the logistic growth equation using the non-linear curve fitting tool from OriginPro program.
Where K stands for the carrying capacity and r for the grow rate.
The fitting is statistically significant at the 5% level, with good R2 , thus the logistic curve explains well the data.
The expression of natural ocurring UCP in the positive control affects slightly its growth in comparison with the negative control. On the other hand, both mutants were affected by the expression of highly functional UCP reducing their carrying capacity regarding the controls. More specifically, 175 deleted growth rate is slowed down, coherent with the glycine mutation that enhances UCP function. We conclude that the functional UCP is possitively expressed in the mutants and confirm that those mutants have an enhanced efficiency in comparison with the natural ocurring strain, UCP+.
Calorimeter characterization curve
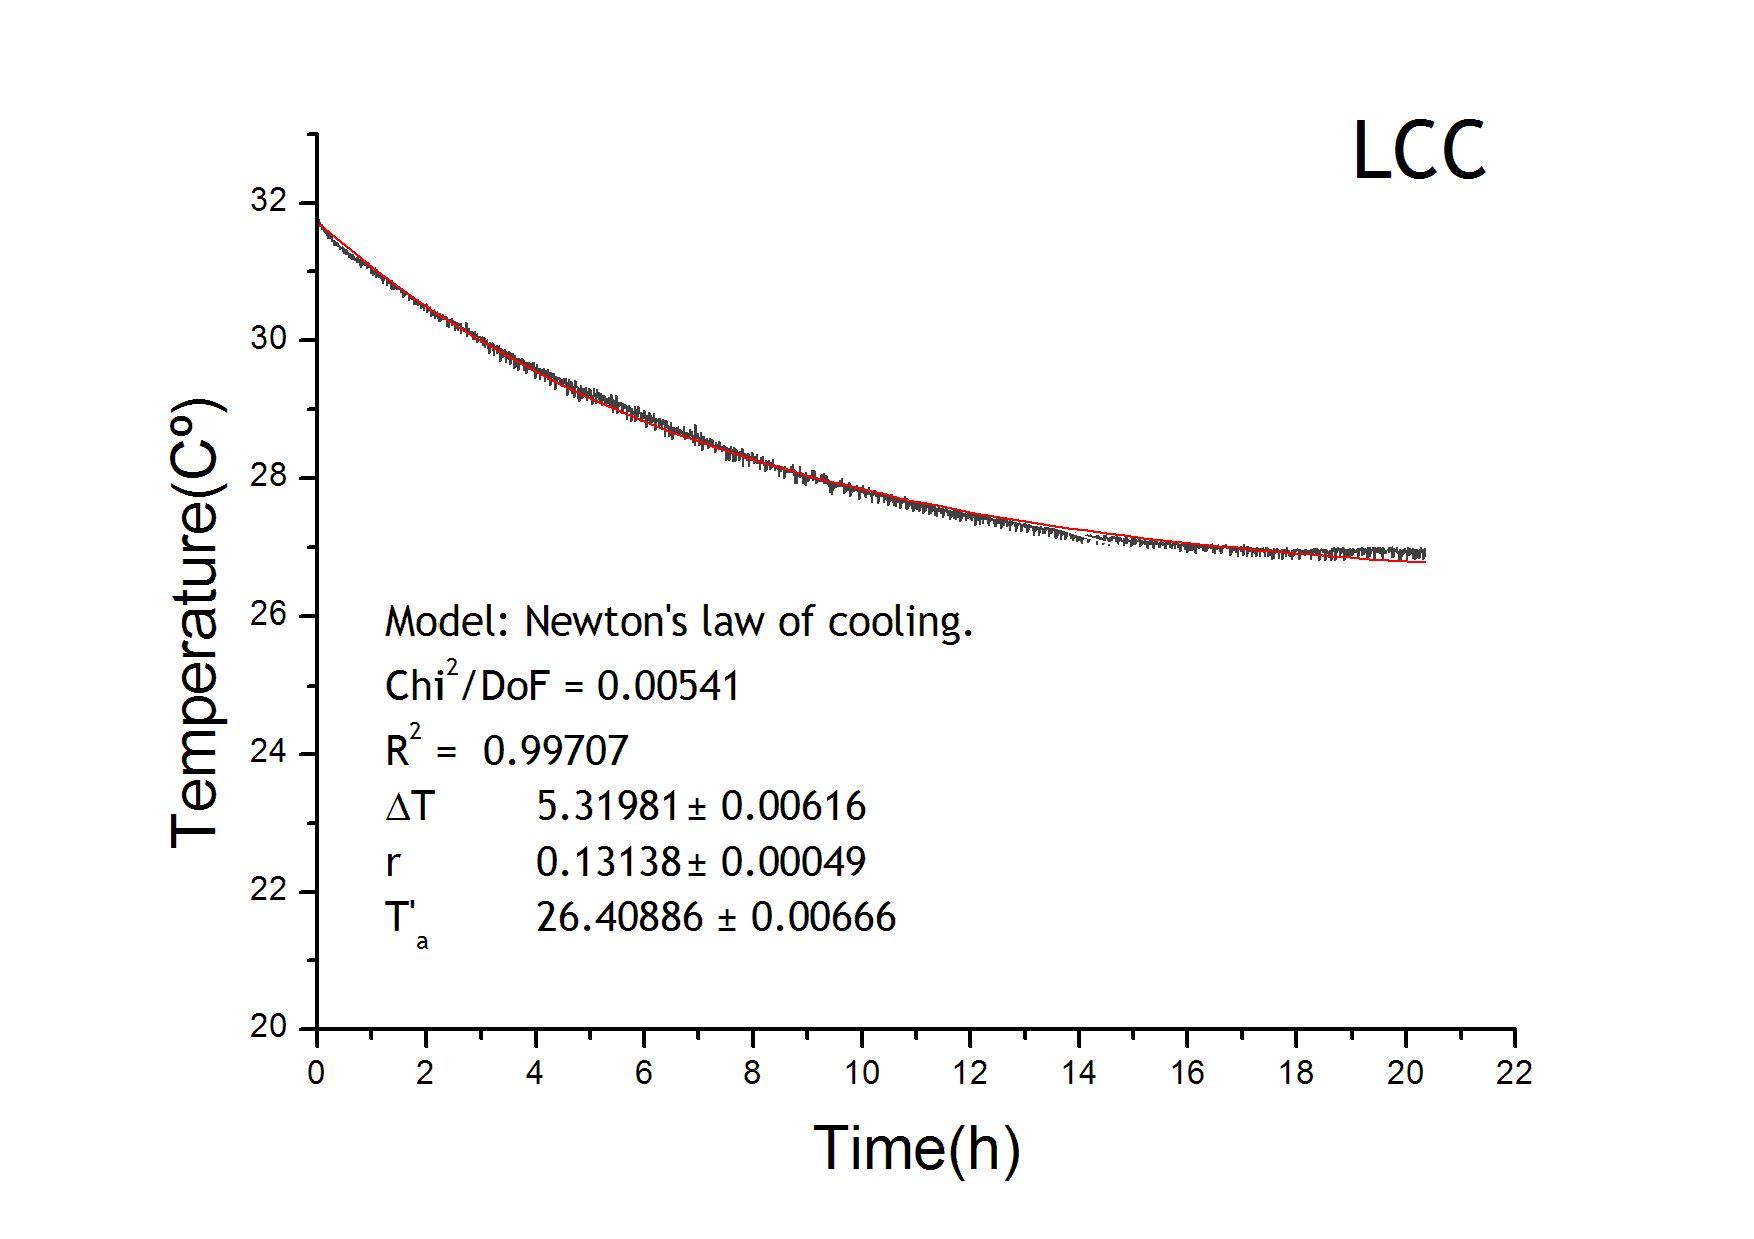
The temperature equation has a heat loss term which follows Newton’s law of cooling. We adjusted the results from the LCC characterization in order to get the parameters for the loss term of the temperature evolution equation. Environment temperature remained constant at 22ºC. From the figure it is also tested that the behaviour of the four calorimeters are equivalent.
UCP expression
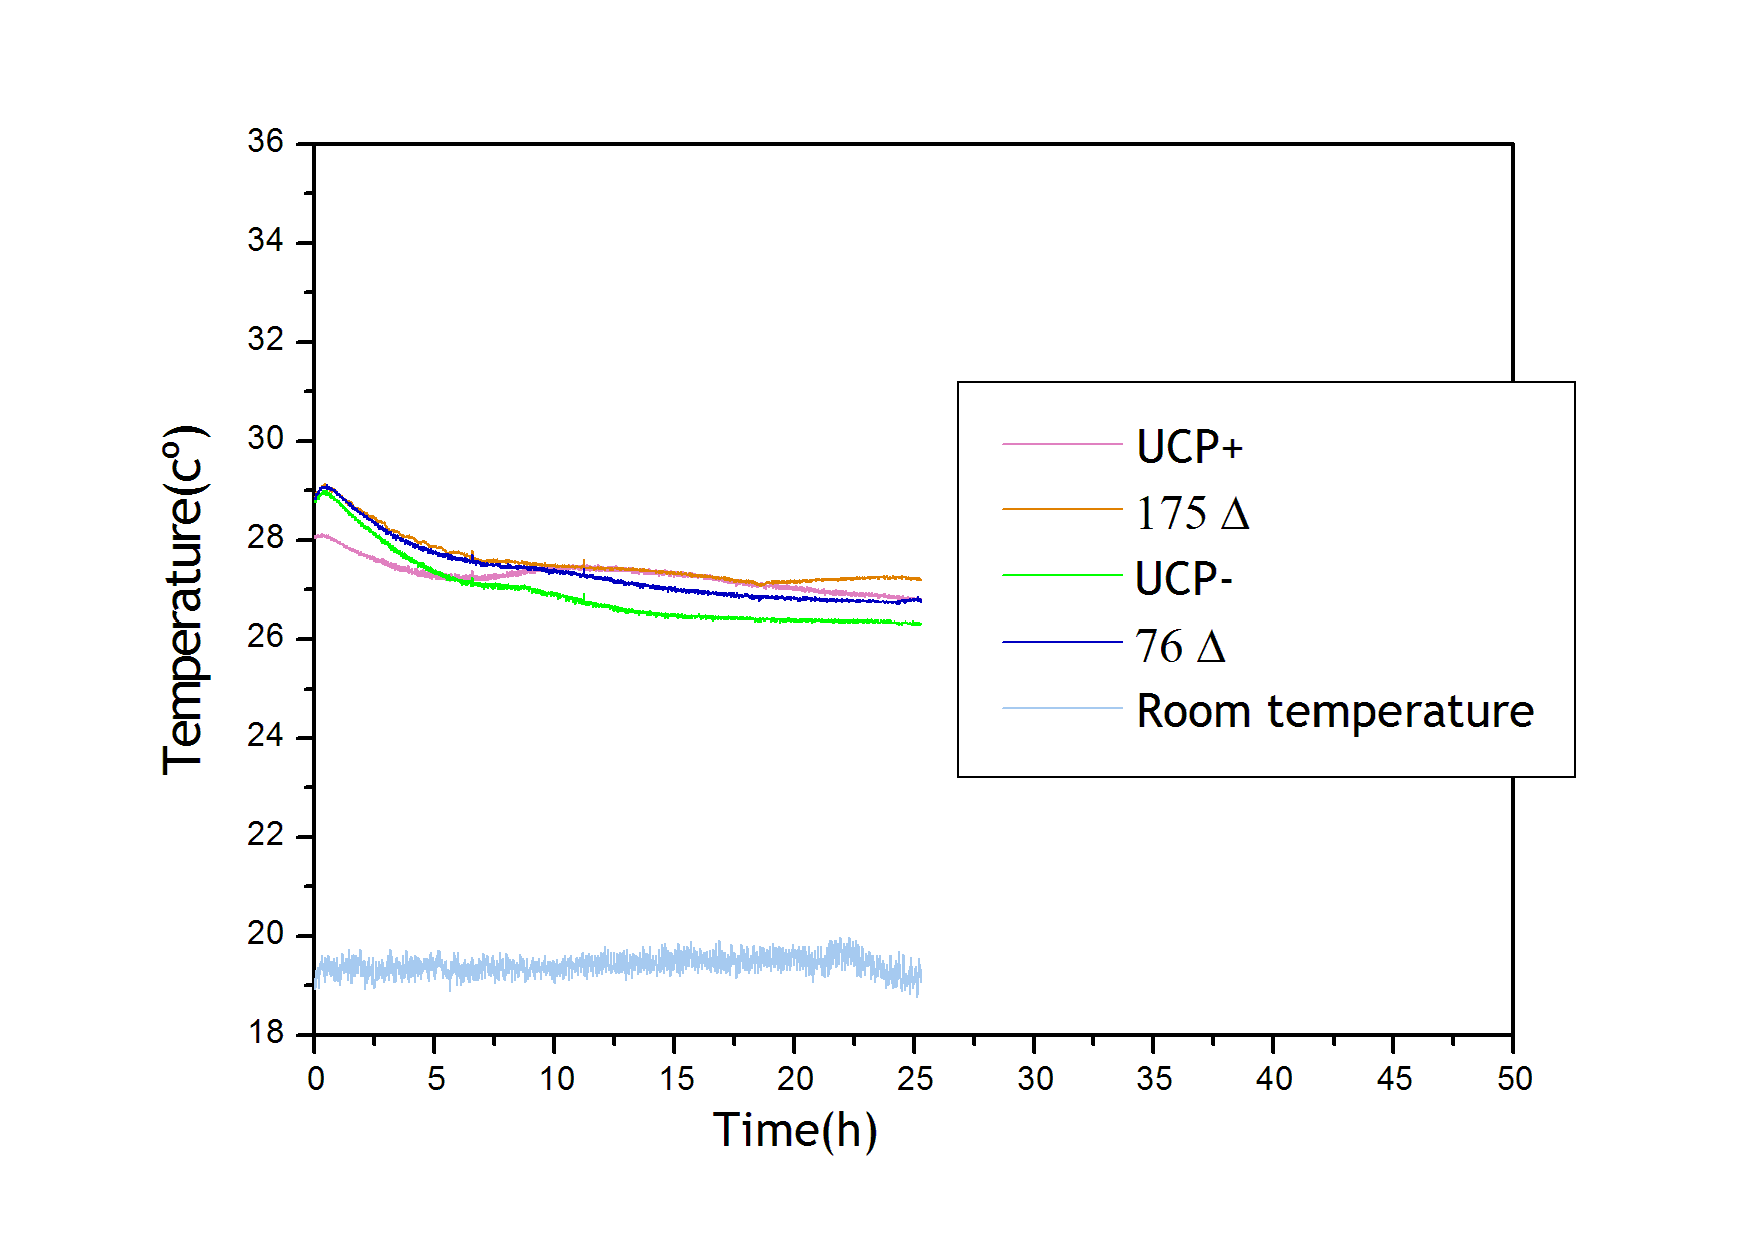
From a sample of 10 experiments in which the evolution of the temperature of the four strain was measured we performed a fit using Simulink software. In the figure there is a representative curve of the experiments.
From the 10 experiments we determined the values of the parameters β 1, α , K1 , β 2,n, γ , ξ . The final values of the parameters were promediated among all the set of experimental data in the following way:
- We assume that the difference between our mutants lays solely on their UCP expression equation parameters (α γ K); the mutants should have the same values for both 175 Δ and 76 Δ asthey use the same Gal promoter.
- The half life of the UCP mutant for the strains 175d and 76 should be similar (by the fit we confirmed that, as we feared that the mutant little deletions would affect protein stability).
- The Hill coefficient (n) was fixed (n=2) in order to reduce the solution space of the parameters.
- The constant β is specific of each strain.
- ε is specific of each strain.
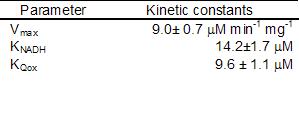
According to this assumptions the obtained values for the characterization of the different strains were:
UCP+ was excluded of the analysis as the results from the set of selected experiments were not clear, and the parameters fluctuated substantially among the experiments.
Analyzing the obtained values for the parameters we can conclude:
- 175 Δ has a higher thermal effect on the system. This result is in agreement with the growth curves in which this strain was the one showing a lower growth. Therefore, this UCP allows a higher flux of protons through the mitocondrial membrane increasing the heat production and reducing the ATP production compared to 76 Δ
- UCP protein has a quite long half life period
- UCP- does not show a significant heat production giving reliability to the obtained results and the followed methodology
- A future improvement of the fit can be performed developing an experimental evaluation of the Galactose consumed during the experiments. In such a way that we can obtain a reduction of the solution space parameters.
To see the graphical representation of the fit go here
Modeling the control system
Our device is able to increase the environment temperature. We would like to control the effect of our system so as to keep the yeast broth in a desired temperature. With these features the final biological construction would resemble a heating system with a thermostat.
In order to achieve this we will need a way of sensing temperature. A possible suitable idea can be a system based on cold shock and heat shock proteins, in fact the iGEM project developed this year by TU Delft can be very inspiring if it is possible to implement something similar in yeast. Therefore, having promoters sensible to temperature give the sensing key for an activator or repressor of the UCP expression. By modifying the strength of the promoter of our constructions we will tune the setpoint temperature to the desired value.
We find two problems in order to implement the system:
- UCP has a high half life time period, this means that our activation/repression control strategy would have a quite delicated problem, mainly because of the lag between the sensing and the effect of the fully functional UCP.
- Cold shock and heat shock proteins found in literature have a range which is between 5-10 K higher or lower than the desired ones (heat shock proteins appears mostly at 37ºC and cold shock proteins appears from 15ºC).
Modeling the oxidative phosphorylation pathway
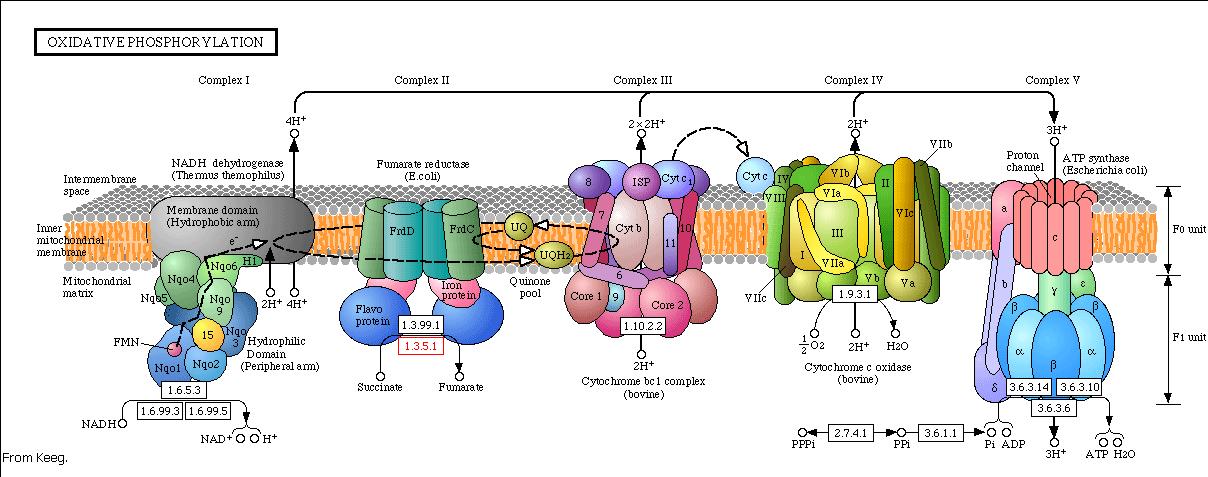
The energy, in form of ATP, necessary for all the cellular processes, is acquired mainly by the oxidative phosphorylation pathway. This pathway is wide-spread through the tree of life because it is a highly efficient way of releasing energy, compared to alternative fermentation processes such as anaerobic glycolysis. In eukaryotic organisms, the reaction takes place in the mitochondria where the electron transport chain catalyzes the electron flow from NADH and FADH 2 to oxygen (becoming reduced to water). This exergonic reaction is coupled with the proton pumping from the matrix through the inner mitochondrial membrane, which generates an electroosmotic gradient used for ATP synthesis. This mechanism is called chemiosmosis, proposed in 1961 by Peter Mitchell.
|
With this model we want to evaluate the effects of the UCP1 in the ATP synthesis. We will take into account general issues about the electron transport chain as well as the particularities of our yeast Saccharomyces cerevisiae. We will have to consider the fermentative pathways presents for further applicability of the model.
Complex I
The first step of the respiratory chain is the oxidation of NADH through complex I (also known as NADH dehydrogenase). This multimeric complex is constituted by 43 different proteins, including a flavoprotein and six iron-sulfur clusters as prosthetic groups. The reactions catalyzed by this complex are coupled, so the exergonic transfer of electrons to quinone promotes the endergonic proton pumping from the matrix to the intermembrane space.
Saccharomyces cerevisiae lacks complex I (Vries et al 1988), but oxidizes NADH with the help two NADH dehydrogenases structurally different from complex I. Complex I is unable to use the citosolic pool of NADH (as is faced to the matrix and NADH does not diffuse through the inner membrane), but NADH dehydrogenases from Saccharomyces cerevisiae use both pools. So there are two enzymes: one uses the external NADH while the other the internal. Both enzymes presence depends on culture growth conditions and phase.
From a structural point of view, these enzymes are much simpler than complex I. This feature is related to the fact that these NADH dehydrogenases transfer electrons without any translocation of protons across the membrane. Because of this reason, we will have two pools of NADH in our model as well as two different equation for NADH dehydrogenation.
The internal NADH dehydrogenase is a single subunit enzyme coded by nuclear DNA. It has FAD as prosthetic group, but lacks iron-sulfur clusters. Unlike complex I, which is a one electron reacting enzyme, internal NADH dehydrogenase is a two electron reacting enzyme, preventing the formation of ROS.
The enzyme follows a bi bi ping pong mechanism.The kinetic data was obtained with the artificial acceptor DCPIP instead of quinone (Velázquez et al 2001), nevertheless we will take its Michaelis constant as a reference for quinone real value.
The diagram shows the reaction, where NADH binds to the enzyme and transfers two electrons to the prosthetic group FAD. After the reduction of the enzyme (F) NAD+ is released and F recovers its redox state by reducing quinone.
The rate equation for the internal NADH dehydrogenase:
The external NADH dehydrogenase must follow the same kinetic scheme. We could not find data for the Michaelis constant for Q as well as for Vmax, so we used the internal dehydrogenase values as an estimation.
The model of this complex is under development.
Hélas we did not have time to finish this detailed model of the effect of UCP on mitochondrial bioenergetics. Anyway, we still had fun with everything we lived this last summer!
TOO SHORT SUMMER OR TOO AMBITIOUS STUDENTS FOR SUCH KIND OF MODELING!!!
References
Abrams, A.; Smith, J.B. (1974); The Enzymes, 3rd Ed. (Boyer, P.D., ed.) Bacterial membrane ATPase 10, 395-429.
Velázquez I.; Pardo J.P. (2001); Kinetic Characterization of the Rotenon-Insensitive Internal NADH: Ubiquinone Oxidoreductase of Mitochondria from Saccharomyces cerevisiae.Archives of Biochemistry and Byophysics.Vol 389 pp 7-14
Vries S.; Grivell L.A: (1988) ; Purification and characterization of a rotenone-insensitive NADH:Q6 oxidoreductase from mitochondria of Saccharomyces cerevisiae.European Journal of Biochemistry. 176: 377-384.
 "
"
