Team:ETH Zurich/Modeling/Overview

From 2008.igem.org

(Difference between revisions)
(Overview on the modelling framework)
Line 30: Line 30:
* Is it possible to identify a restriction enzyme that optimizes the probability of reduced genome that retains vital strains?<br><br>
'''Method:'''<br>
'''Method:'''<br>
-
E.Coli K12 genome was digested using 713 different restriction enzymes and, using annotation information, simple statistical analysis was applied on the calculated fragments.
+
E.coli K12 genome was digested using 713 different restriction enzymes and, using annotation information, simple statistical analysis was applied on the calculated fragments.
<br><br>
<br><br>
'''Results:''' <br>
'''Results:''' <br>
Line 45: Line 45:
* Which are the predicted quantitative differences in terms of growth rate and genome size of strains on which has been applied the selection procedure? <br><br>
'''Method:''' <br>
'''Method:''' <br>
-
The state-of-the-art genome scale model for E.Coli iAF1260 (1,260 genes included) was modified in order to account for thymidine auxotrophycity, thymidine uptaking limitation, genome reduction and growth on different  medium. Stochastic algorithm and flux balance analysis were applied to predict growth rates.<br><br>
+
The state-of-the-art genome scale model for E.coli iAF1260 (1,260 genes included) was modified in order to account for thymidine auxotrophycity, thymidine uptaking limitation, genome reduction and growth on different  medium. Stochastic algorithm and flux balance analysis were applied to predict growth rates.<br><br>
'''Results:''' <br>
'''Results:''' <br>
Models show that is indeed possible to select reduced genome strains using thymidine limitation. The quantification shows that the method is at the border line with the sensitivity of chemostat machinery setup for small differencies, but is effective for big reductions (from approximately 10 Kbp on). Predictions show the possibility of reducing up to 61 % of genes for a minimal medium growing strains (corresponding to 59% of chromosome size) and 73 % of genes for rich medium growing strains (corresponding to 71% of chromosome size).<br><br>

Revision as of 03:35, 30 October 2008

Overview on the modelling framework

This page is meant to give an introduction to the overall modelling framework we have constructed in order to assess feasibility analysis, temporal scale details and other parameter estimations with regard of our project setup. As introduced in the Project Overview section, four main components can be identified in the devised mechanism. Accordingly, we divided the modeling framework in four modules that address different challenges.
The first module is concerned with the analysis of restriction enzymes and their cutting pattern on E.coli genome. The second module predicts the cell's response to the selection pressure and the forced genome reduction from a systems point of view (that is, using a genome scale model). The third module addresses issues related to the sensitivity and setting of the chemostat mechanism. The fourth and final module presents the model of the genetic switch circuit used to control the restriction enzymes expression.
In the table below, you can find a birds-eye view on the four modules, with the most important aspects highlighted. Since we believe that a model is only useful when it answers specific and well-posed questions, this is the first aspect we report in the summary view. Second, we briefly report about the modeling method applied. Finally, we summarize the results we obtained.
By clicking on each module's title, you can browse the specific module pages containing all the detailed information, such as plots, modelling assumptions and data sources. Note that it is possible to download from our Downloading Page all the data and code (MATLAB source) that we used and wrote in order to generate our results.

Modelling Framework

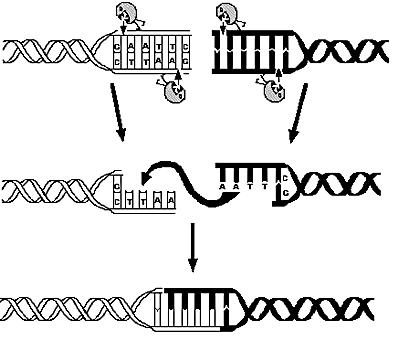
1) Restriction Enzymes Analysis

RestEnzymesIntro.jpg

Questions:

  • Which are the available restriction enzymes and cutting patterns?
  • How is the distribution of the genes in each fragment related to the frequency of cutting?
  • Is it possible to identify a restriction enzyme that optimizes the probability of reduced genome that retains vital strains?

Method:
E.coli K12 genome was digested using 713 different restriction enzymes and, using annotation information, simple statistical analysis was applied on the calculated fragments.

Results:
The property of restriction enzymes are all related to their frequency of cutting. The mean number of genes per fragment, as well as its variance and the probability of containing essential genes, can be derived only from frequency information.

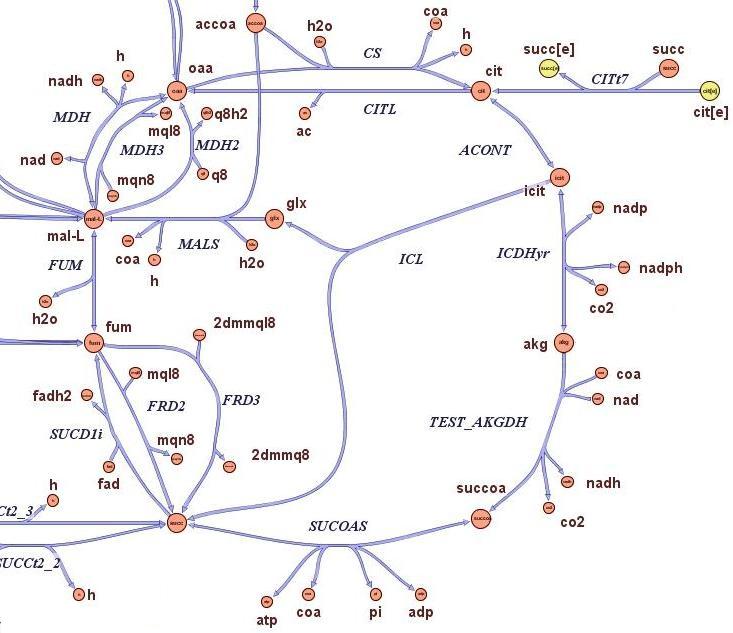
2) Genome Scale Analysis

GenomeScaleIntro.jpg

Questions:

  • Is it possible to slow growth of large genome strains by using a thymidine auxotrophyc strain and limiting thymidine feeding?
  • What is the best restriction enzyme to be used in order to maximize genome reduction and at the same time vitality (growth rate) of thymidine auxotrophyc strains?
  • What is the predicted genome reduction difference if the medium is minimal or very rich in terms of nutrients?
  • Which are the predicted quantitative differences in terms of growth rate and genome size of strains on which has been applied the selection procedure?

Method:
The state-of-the-art genome scale model for E.coli iAF1260 (1,260 genes included) was modified in order to account for thymidine auxotrophycity, thymidine uptaking limitation, genome reduction and growth on different medium. Stochastic algorithm and flux balance analysis were applied to predict growth rates.

Results:
Models show that is indeed possible to select reduced genome strains using thymidine limitation. The quantification shows that the method is at the border line with the sensitivity of chemostat machinery setup for small differencies, but is effective for big reductions (from approximately 10 Kbp on). Predictions show the possibility of reducing up to 61 % of genes for a minimal medium growing strains (corresponding to 59% of chromosome size) and 73 % of genes for rich medium growing strains (corresponding to 71% of chromosome size).

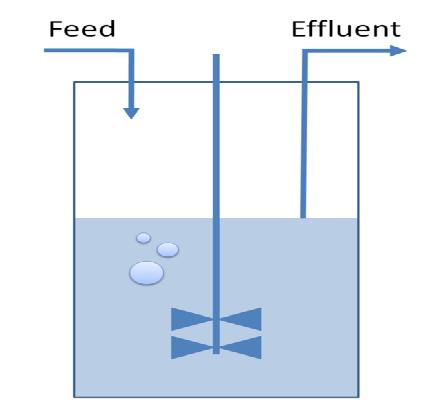
3) Chemostat Selection Method

ChemostatSmallIntro.jpg

Questions:

  • What are the ideal settings of nutrient concentrations and influx in order to select reduced strains?
  • Which is the sensitivity regarding growth rate selection?
  • What are the timing parameters that frame the induction of two subsequent rounds of restriction enzyme expression?


Method:
A classical chemostat model using Ordinary Differential Equations was constructed and analyzed in terms of sensitivity analysis and simulation of realistic data.

Results:


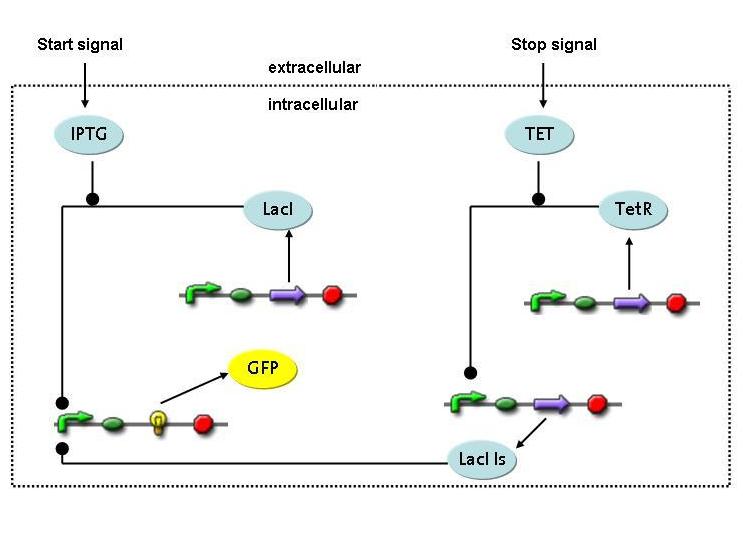
4) Switch Circuit

Circuit overview.JPG

Questions:

  • Is it possible to design a simple but effective system for initiating and terminating restriction enzyme expression in a very tight way?
  • What are the biological parameters important in such a design?
  • What are the temporal constrains for the device to be used in the selection scenario?

Method:
A novel transcriptional circuit able to sense an initiating and terminating signal and to control a pulse of restriction enzyme was designed and analyzed using Ordinary Differential Equations.

Results:
The simulations show that the designed circuit is indeed able to produce a pulse-shaped response in the protein of interest which can be turned on and off by the two different inducers. Moreover the gene expression can be influenced by changing the degradation rate of the protein, for instance by tagging it, or modifying its repressors transcription rate. The pulsing frequency is mainly constrained by the time it takes for the inducers to be washed out of the medium.