Team:BrownTwo/Limiter/modeling
From 2008.igem.org
(→Modeling results) |
|||
| Line 21: | Line 21: | ||
=Modeling results= | =Modeling results= | ||
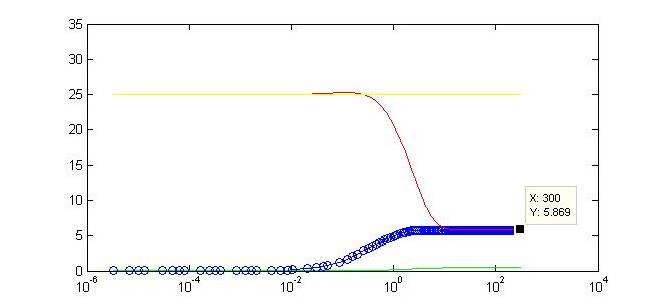
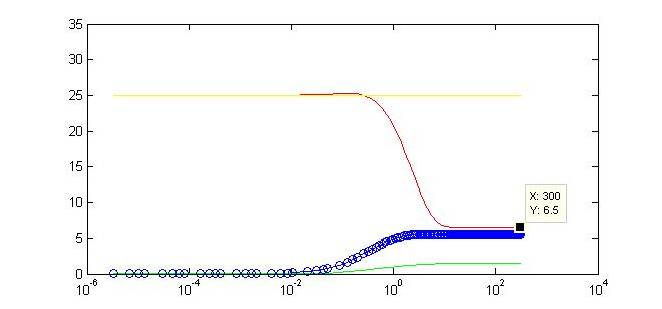
| - | Here we display one of numerous modeling configurations used to understand the behavior of our system. In this situation, we vary the constitutive strength of the promoter controlling expression of gene Y. Specific values have been included below. These values reflect experimental values taken for some of the same synthetic transcription factors. | + | Here we display one of numerous modeling configurations used to understand the behavior of our system. In this situation, we vary the constitutive strength of the promoter controlling expression of gene Y. Specific values have been included below. These values reflect experimental values taken for some of the same synthetic transcription factors (Ajo-Franklin et al., 2007). Many parameters were made to be equal for simplification of the modeling analysis. |
Initial values: X = Y =Z = 0 I = G = 25 | Initial values: X = Y =Z = 0 I = G = 25 | ||
| Line 52: | Line 52: | ||
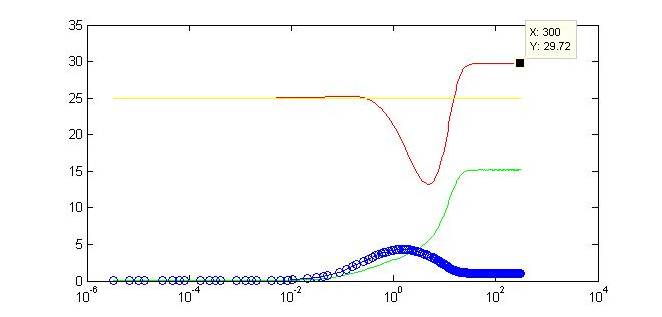
[[Image:alpha_y_=_10.jpg|thumb|αY = 10]] | [[Image:alpha_y_=_10.jpg|thumb|αY = 10]] | ||
| - | Not only do we display the regulation of our gene of interest to a certain threshold at the end of our timecourse, but we can observe a tunable threshold as this steady state value changes with varying strengths of the . By tweaking certain biologically-relevant parameters is possible to alter the behavior. The ability to swap in different promoters | + | Not only do we display the regulation of our gene of interest to a certain threshold at the end of our timecourse, but we can observe a tunable threshold as this steady state value changes with varying strengths of the promoter driving expression of Y. By tweaking certain biologically-relevant parameters is possible to alter the behavior. The ability to swap in different promoters or to alter binding affinities will make our limiter flexible for regulation in varied biological systems. Continued part characterization will only further contribute to the ability to predict the results of this tuning. |
Latest revision as of 03:56, 30 October 2008
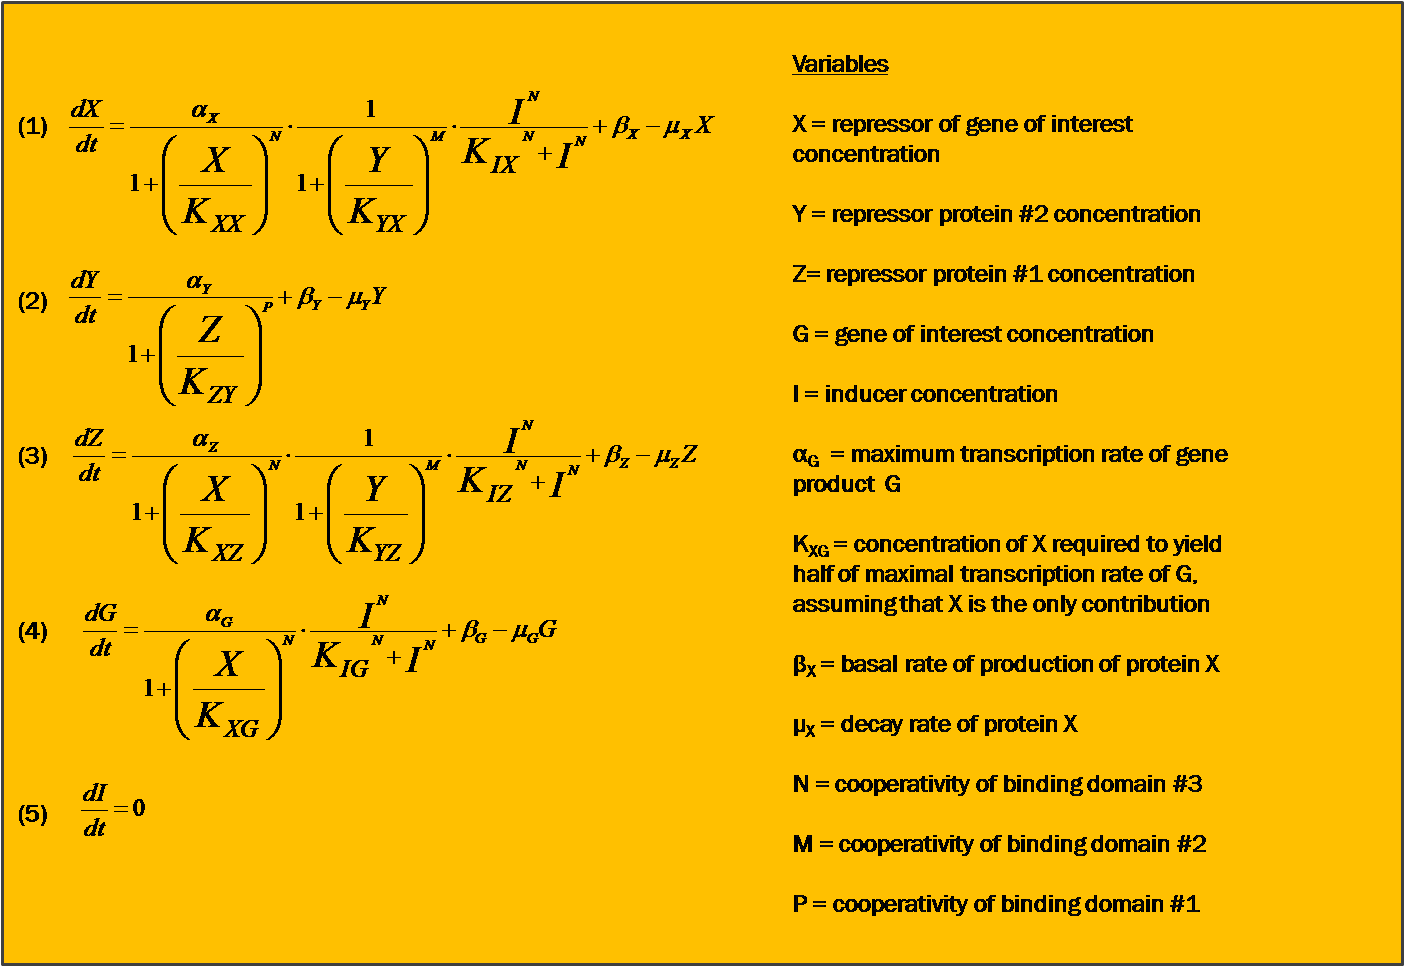
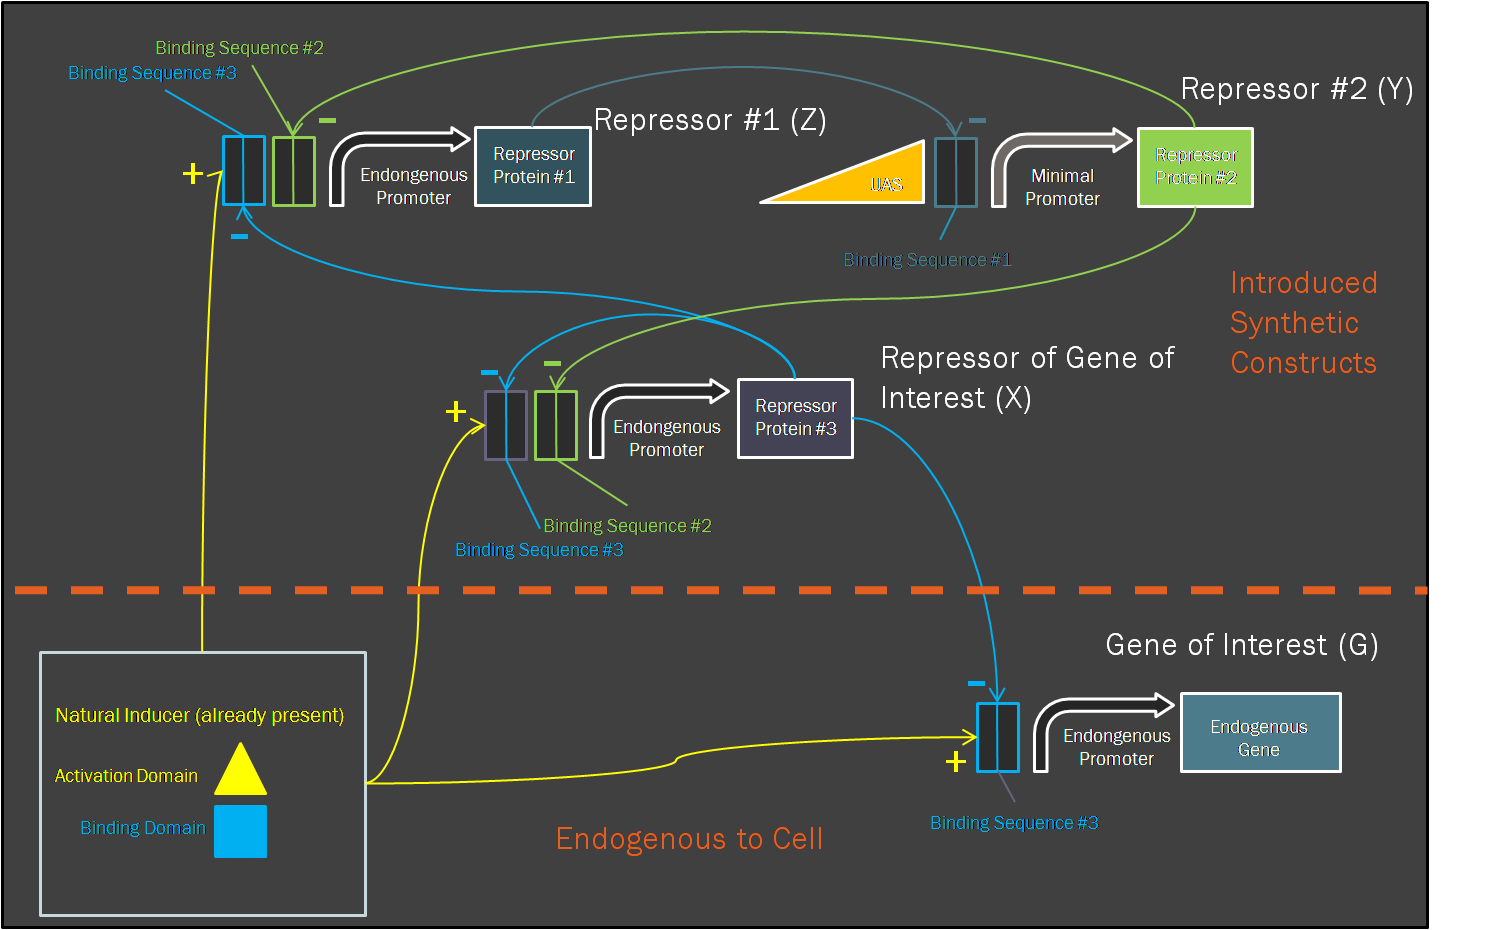
Motivation for ModelingIn contrast to pure experimentation, modeling allows for the rational design of synthetic biological systems. Part characterization makes it possible to apply the known activity of genetic parts to developing a prediction of their qualitative behavior when they are pieced together into a composite device. Such an approach was aptly demonstrated in the paper by Dr. Ajo-Franklin (Ajo-Franklin et al., 2007). They generated a Hill equation model for composite system, to which they applied experimentally-quantified values for the parameters representing the individual parts in the system. Their predictions with this approach matched up considerably well to measurements they made once they have built their final device. Seeing as we incorporating many of the same parts into our own limiter network, we decided to modify their Hill equations to suit our particular design. It was important for us to model our system because it was necessary to ascertain, given the complexity of the transcriptional interactions, whether the design would generate our desired threshold-driven output. Hill equationAccording to a Hill equation, it is possible to model the relationship between a gene (G) and its transcription factors. The equation varies slightly depending upon whether the transcription factor has an activating or inhibitory effect, and one observes a multiplicative effect if several factors regulate expression of the same gene. We have modeled all gene products in our system using the following equations: One will note that the variables correspond to this diagram of our system. Modeling resultsHere we display one of numerous modeling configurations used to understand the behavior of our system. In this situation, we vary the constitutive strength of the promoter controlling expression of gene Y. Specific values have been included below. These values reflect experimental values taken for some of the same synthetic transcription factors (Ajo-Franklin et al., 2007). Many parameters were made to be equal for simplification of the modeling analysis. Initial values: X = Y =Z = 0 I = G = 25 Parameters values: αX = αZ = αG = 15 αY varies between 0 and 10 All K values = 2.9 All cooperativities = 2.3 All decay rates = 0.5 All basal rates = 0.2
Not only do we display the regulation of our gene of interest to a certain threshold at the end of our timecourse, but we can observe a tunable threshold as this steady state value changes with varying strengths of the promoter driving expression of Y. By tweaking certain biologically-relevant parameters is possible to alter the behavior. The ability to swap in different promoters or to alter binding affinities will make our limiter flexible for regulation in varied biological systems. Continued part characterization will only further contribute to the ability to predict the results of this tuning. |
 "
"
