Team:BCCS-Bristol/Calendar-Notebook/21 July 2008
From 2008.igem.org
(→Swimming agar assay) |
|||
| Line 17: | Line 17: | ||
| - | == ''' | + | == '''Growth curve measurement''' == |
| - | The OD of | + | The OD<sub>600</sub> of ''E. coli'' MC1000 and MG1655 was measured over a day so that we would know whether the bacteria were in their log phase in any experiments requiring innoculation of bacteria. |
| - | A, B and C show 100, 500 and | + | A, B and C show 100, 500 and 200 µl innoculations of overnight culture in 50 ml LB broth, respectively. |
| Line 90: | Line 90: | ||
| 520||0.65||0.673||0.723||||0.453||0.522||0.523 | | 520||0.65||0.673||0.723||||0.453||0.522||0.523 | ||
| - | |||
|} | |} | ||
| - | [[Image: | + | {|align="center" |
| + | |||
| + | |[[Image:BCCS-080721-growth curve E. coli MC1000 and MG1655.PNG | 700px]] | ||
| + | |||
| + | |} | ||
==Swimming agar assay== | ==Swimming agar assay== | ||
Revision as of 12:41, 8 August 2008
Growth curve measurement
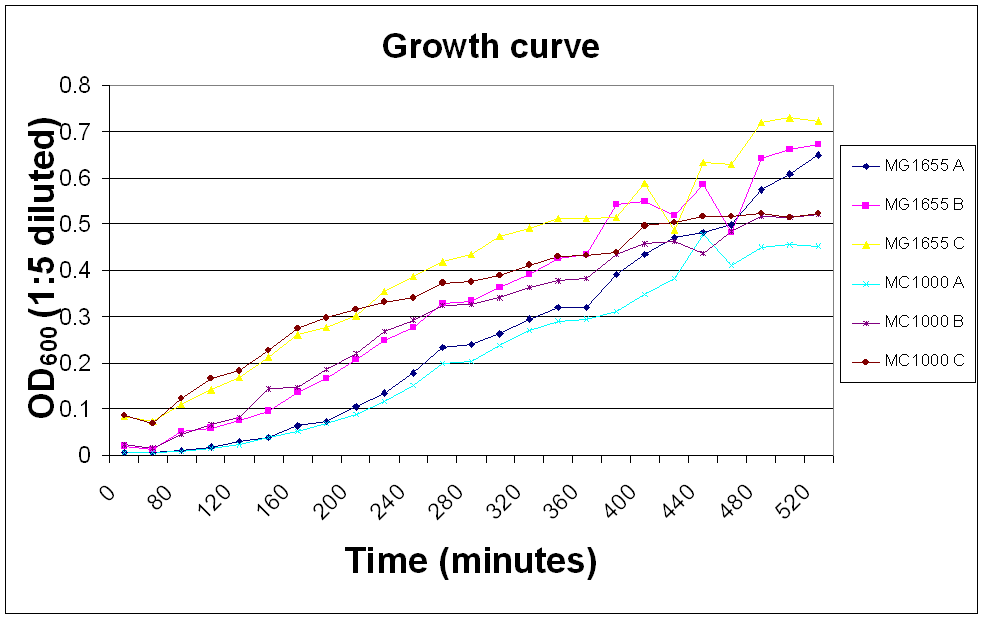
The OD600 of E. coli MC1000 and MG1655 was measured over a day so that we would know whether the bacteria were in their log phase in any experiments requiring innoculation of bacteria.
A, B and C show 100, 500 and 200 µl innoculations of overnight culture in 50 ml LB broth, respectively.
| Time (minutes) | OD600 (1:5 diluted) |
| |||||
| MG1655 | MC1000 | ||||||
| A | B | C | A | B | C | ||
| 0 | 0.0016 | 0.0042 | 0.017 | 0.0016 | 0.0044 | 0.0174 | |
| 60 | 0.008 | 0.013 | 0.073 | 0.006 | 0.017 | 0.068 | |
| 80 | 0.011 | 0.052 | 0.109 | 0.009 | 0.046 | 0.123 | |
| 100 | 0.019 | 0.059 | 0.142 | 0.017 | 0.067 | 0.167 | |
| 120 | 0.029 | 0.076 | 0.169 | 0.024 | 0.083 | 0.183 | |
| 140 | 0.039 | 0.095 | 0.213 | 0.039 | 0.144 | 0.226 | |
| 160 | 0.063 | 0.136 | 0.26 | 0.053 | 0.147 | 0.275 | |
| 180 | 0.074 | 0.166 | 0.276 | 0.069 | 0.186 | 0.298 | |
| 200 | 0.105 | 0.207 | 0.301 | 0.089 | 0.22 | 0.316 | |
| 220 | 0.134 | 0.25 | 0.355 | 0.116 | 0.268 | 0.331 | |
| 240 | 0.178 | 0.276 | 0.386 | 0.151 | 0.293 | 0.341 | |
| 260 | 0.233 | 0.329 | 0.419 | 0.198 | 0.325 | 0.372 | |
| 280 | 0.239 | 0.334 | 0.435 | 0.203 | 0.326 | 0.375 | |
| 300 | 0.263 | 0.363 | 0.473 | 0.238 | 0.34 | 0.388 | |
| 320 | 0.296 | 0.391 | 0.491 | 0.27 | 0.364 | 0.412 | |
| 340 | 0.319 | 0.425 | 0.511 | 0.29 | 0.378 | 0.429 | |
| 360 | 0.32 | 0.435 | 0.512 | 0.294 | 0.382 | 0.432 | |
| 380 | 0.392 | 0.542 | 0.514 | 0.311 | 0.434 | 0.438 | |
| 400 | 0.435 | 0.549 | 0.588 | 0.348 | 0.457 | 0.497 | |
| 420 | 0.47 | 0.52 | 0.487 | 0.382 | 0.462 | 0.504 | |
| 440 | 0.483 | 0.586 | 0.633 | 0.477 | 0.437 | 0.516 | |
| 460 | 0.498 | 0.482 | 0.629 | 0.411 | 0.484 | 0.517 | |
| 480 | 0.574 | 0.643 | 0.721 | 0.451 | 0.516 | 0.524 | |
| 500 | 0.607 | 0.66 | 0.73 | 0.455 | 0.514 | 0.515 | |
| 520 | 0.65 | 0.673 | 0.723 | 0.453 | 0.522 | 0.523 |

|
Swimming agar assay
Chemotaxis experiment for MG1655 and MC1000 showed no real difference between the control (water) and the aspartate. This may have been due to higher agar concentration caused by an unusually large water loss in autoclaving, causing high concentrations of agar. The experiment was repeated today.
BioBrick Transformation
The transformation of bacteria with BioBrick from paper was started. Therefore, a hole was punched out and put in TE buffer (below) following protocol on iGEM sheet.
Miscellaneous
DMSO stocks of E. coli MC1000 and MG1655 were made as back up in the -80oC freezer.
 "
"