Team:Purdue/Modeling
From 2008.igem.org
| Line 24: | Line 24: | ||
| - | |||
| - | |||
| - | |||
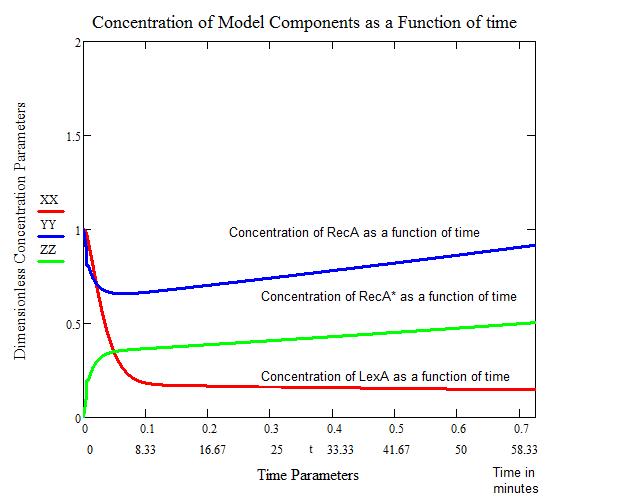
The first figure below shows the response to a 5 J/m^2 UV irradiation. We see that the concentration of '''bound''' LexA drops considerably within the first four minutes. This also correlates with the concentration of activated RecA (RecA*) going up appreciably. After approximately 60 minutes, the concentration of RecA returns to a normal level. We therefore consider this the "stopping" point of SOS. | The first figure below shows the response to a 5 J/m^2 UV irradiation. We see that the concentration of '''bound''' LexA drops considerably within the first four minutes. This also correlates with the concentration of activated RecA (RecA*) going up appreciably. After approximately 60 minutes, the concentration of RecA returns to a normal level. We therefore consider this the "stopping" point of SOS. | ||
| Line 38: | Line 35: | ||
#Showing the general trend of how SOS behaves. | #Showing the general trend of how SOS behaves. | ||
#Gives us a time frame for how our color reporters need to work to be feasible. | #Gives us a time frame for how our color reporters need to work to be feasible. | ||
| - | |||
| - | |||
| - | |||
| - | |||
| Line 49: | Line 42: | ||
''All Calculations and the figures above were performed in MathCad, utilizing built in Runge-Kutta 4th order function, by Craig Barcus, utilizing the mathematical model presented by SV. Aksenov in 1997.'' | ''All Calculations and the figures above were performed in MathCad, utilizing built in Runge-Kutta 4th order function, by Craig Barcus, utilizing the mathematical model presented by SV. Aksenov in 1997.'' | ||
| + | |||
| + | |||
| + | |||
| + | {|align="justify" | ||
| + | |[[Image:PurdueFullModel.jpg|10px|center|frame]] | ||
| + | |- | ||
| + | |[[Image:PurdueIntersectionsModel.jpg|10px|center|frame]] | ||
| + | |-|} | ||
| + | |||
| + | |||
Revision as of 16:48, 25 September 2008
Modeling Objectives
- Develop a mechanistics ODE model of the population to predict gene expression dynamics
- Question? .... Will the color production be fast enough to be useful to the user? Or will it be too late?
- What is the relationship between UV exposure and reporter gene expression?
- Can we construct a useful calibration curve of color as a function of UV?
Modeling References
- 1997. "Mathematical model of the SOS response regulation of an excision repair deficient mutant of Escherichia coli after UV light irradation". [http://www2.lib.purdue.edu:2184/science?_ob=ArticleURL&_udi=B6WMD-45KKS62-5S&_user=29441&_coverDate=05%2F21%2F1997&_rdoc=1&_fmt=&_orig=search&_sort=d&view=c&_version=1&_urlVersion=0&_userid=29441&md5=7297869ffc31d1edfcd20856301793a5]. Off-the-shelf mechanistic model of the SOS response. Utilized as the basic model for our system.
- 2005. "Response times and mechanisms of SOS induction by attaching promoters to GFP: "Precise Temporal Modulation in the Response of the SOS DNA Repair Network in Individual Bacteria" [http://www.pubmedcentral.nih.gov/articlerender.fcgi?artid=1151601]. Potential Validation Data Set. Model should predict similar dynamics.
Modeling the SOS response in a uvr- mutant (No nucleotide excision repair)
Assumptions
- The UV light intensity is constant and instantaneous.
- The bacteria are not undergoing any type of DNA repair at the time of UV exposure.
- Thymine dimer formation is the major DNA damage occurring.
The first figure below shows the response to a 5 J/m^2 UV irradiation. We see that the concentration of bound LexA drops considerably within the first four minutes. This also correlates with the concentration of activated RecA (RecA*) going up appreciably. After approximately 60 minutes, the concentration of RecA returns to a normal level. We therefore consider this the "stopping" point of SOS.
The problems with this model include:
- The model is based on an instantaneous irradiation of UV at 5 J/m^2.
- The model does not account for continuous UV exposure.
- The model does not account for any other proteins/genes that may be involved in SOS (ie. SulA).
The benefits of this model include:
- Giving us a mathematical, manipulateable model to mend for our purposes.
- Showing the general trend of how SOS behaves.
- Gives us a time frame for how our color reporters need to work to be feasible.
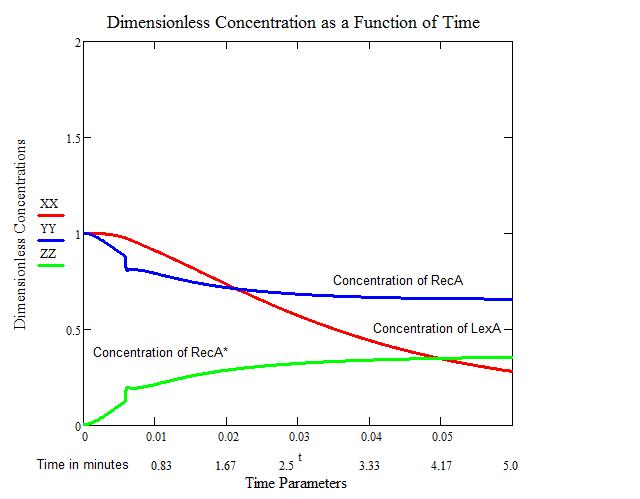
The second figure provides us with a close-up view of the increase in RecA* and decreases of LexA and RecA. We see that an artifact occurs around the 30 second mark. This artifact is related to the step-wise function that occurs in the model. Over the larger time frame, this artifact is negligible.
Since we have no quantitative data on the activation and deactivation of SOS, we must make an assumption as to when SOS truly starts to take effect. We will consider the intersection of LexA and RecA* to be the initial time when SOS can start repairing the damage accrued by UV irradiation.
All Calculations and the figures above were performed in MathCad, utilizing built in Runge-Kutta 4th order function, by Craig Barcus, utilizing the mathematical model presented by SV. Aksenov in 1997.
| Home | The Team | The Project | Parts Submitted to the Registry | Modeling | Notebook | Tools and References |
|---|
 "
"


