Team:Alberta NINT/Modeling
From 2008.igem.org
m (header bar w/ links colour change) |
|||
| Line 276: | Line 276: | ||
<li>See for more information: http://dinamelt.bioinfo.rpi.edu/refs.php</li> | <li>See for more information: http://dinamelt.bioinfo.rpi.edu/refs.php</li> | ||
</ul> | </ul> | ||
| + | |||
| + | ='End Result'= | ||
Revision as of 07:08, 19 October 2008
Contents |
Modeling
Ability to model the folding of the designed RNA was desired not only to help visualize how the pieces would look, but also to investigate how interactions between the inputs and outputs of the various genetic gates would play out. It is also important to examine possible interactions between the outputs of different gates as well as with other things that may be present in the cell. Reasonably accurate modeling could help lower cost of purchased DNA, save lab time, and result in a a more reliable final product.
All modeling has been done using RNAStructure 4.5/4.6 (http://rna.urmc.rochester.edu/rnastructure.html)
Source code for this program was obtained with the hopes of making changes that would increase usability, as well as introduce new functions to the program that would allow it to be more useful for simulating some of the situations that may arise during the operation of the logic gate.
Currently, compiler version issues have prevented such changes from being implemented and tested.
From Scratch
Windows access has been lacking for me for a few days now, so I played around with some single-stranded RNA folding. Definitely not the easiest thing to do...
The test sequence was folded in RNAStructure 4.6 run under Wine on a Linux system. The program used to generate the folds used a computational intelligence method to try and derive a probable fold. Refinements to the estimation of the folding energy of a structure have been made with the hopes of creating folds with some semblance of accuracy, but the problem may lie in the crossover/mutation operations being used in the evolutionary/genetic algorithm.
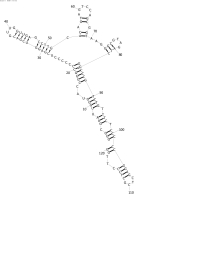
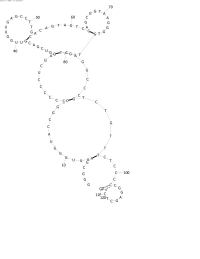
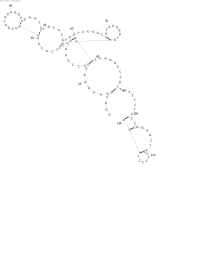
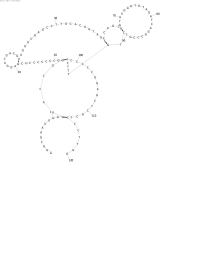
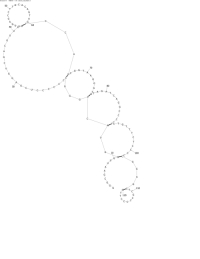
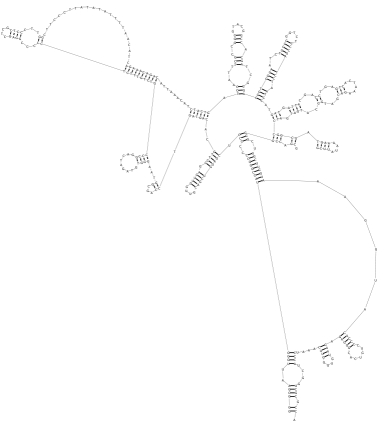
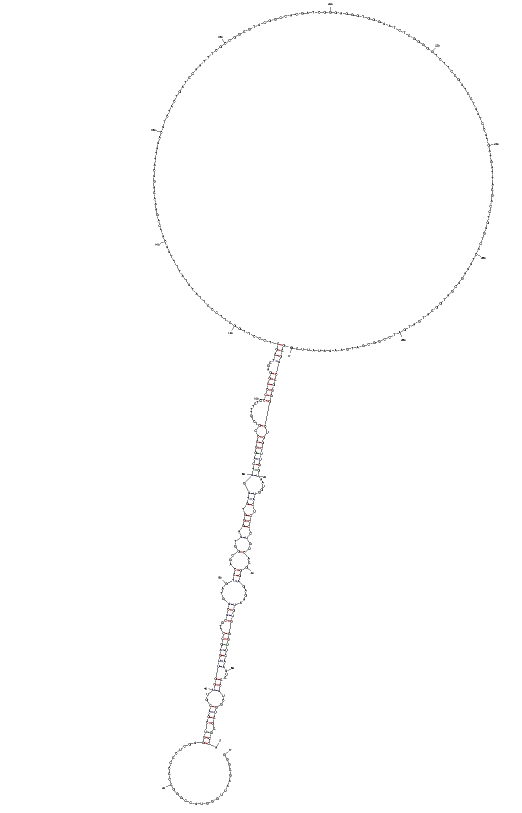
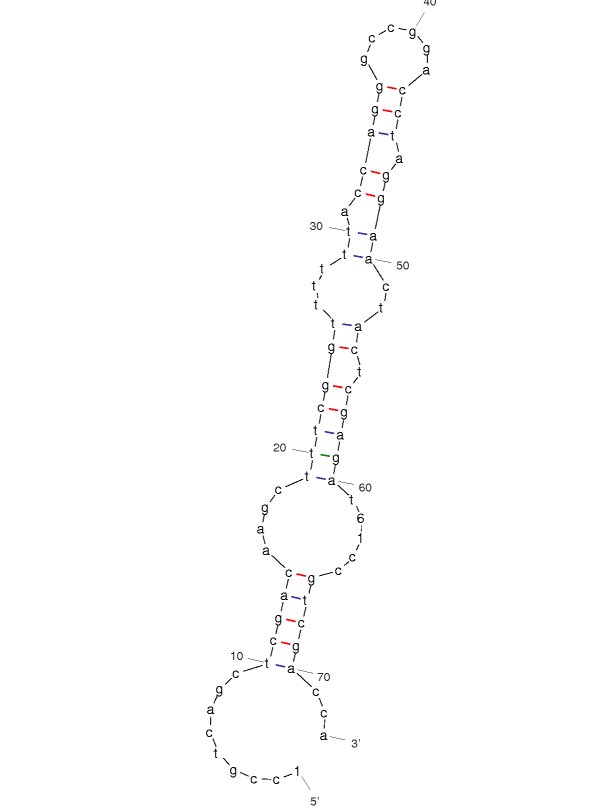
Pictures so I can feel as if I've accomplished something (these diagrams were made using the 'Draw' function in RNAstructure:
The first few series were made trying improve the energy estimation subroutine. Series A was performed using only mutation and turbo simplistic energy rules. A bit of an refinement was made for Series B, as well as a change to the rate of mutation, which made it more dependent on the sequence length. Series C and D added a crossover operation to the mix, each was different in its treatment of bonds that had been broken at the point of crossing over. None of the series have exhibited any noticeable improvement over any of the others.
As viewed in the pictures, scaled for space, the common problem seems to be the creation of adjacent bonds (if that makes sense). Judging by the energy rules that are currently being employed, the problem likely resides in the EA.
Update: After correcting some huge, yet craftily placed errors, the program behaves the way I expected it to. Since the its energy rules are primarily based on bonding, the program tries for as many bonds as possible. Its gotten to the point were the Draw program in RNAstructure is not properly drawing the connection tables, due to the complexity of fold that that the program came up with. This might be able to be fixed by providing an energy penalty for folds where the program tries to tie the RNA up into a big knot. Also thinking of using the scatterplot from the matplotlib library for python in order to draw (at least primitively) folds inside the program for convenience.
Interfacing and Modification of Existing Programs
Single Sequence Folding Comparison
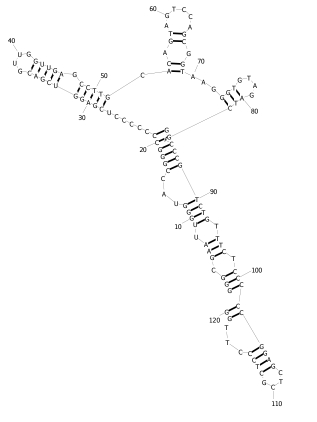
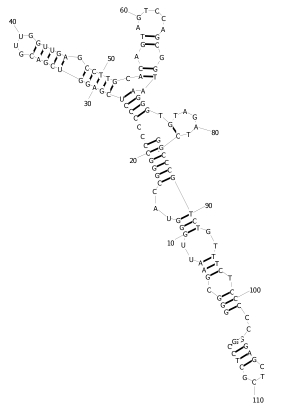
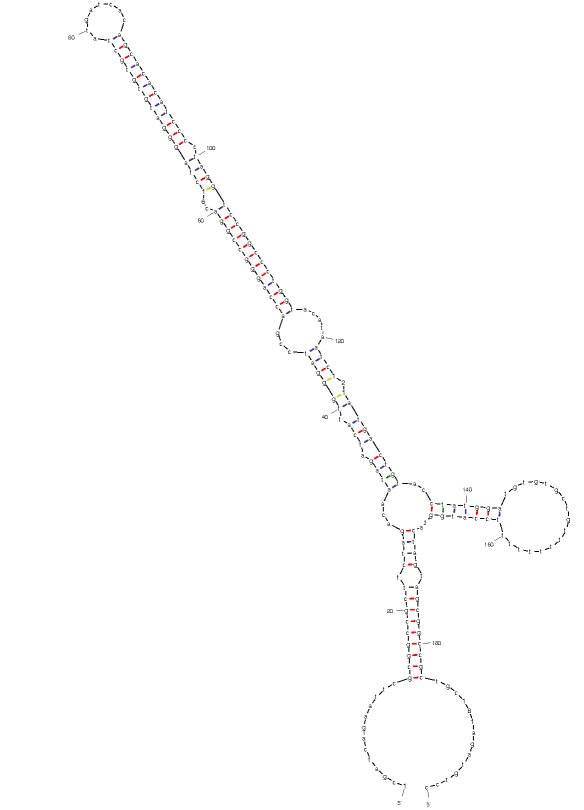
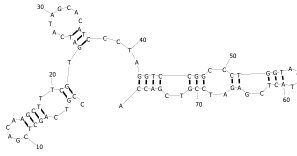
Since working from scratch is pretty tough, modification of existing open source programs is being pursued. The favorite, RNAStructure has proven difficult to compile and have run, so an older program, UNAFold, is being looked at. In a comparison using arbitrary sequences, both programs produced fairly similar results.
As the plots show, the structures have a few differences, but are largely the same. The RNAStructure program predicted an energy of -39.8 Kcal/mole, while the UNAFold program predicted a slightly different energy of -38.3 Kcal/mole.
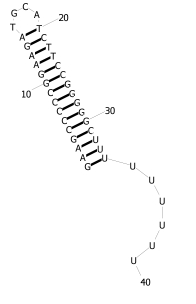
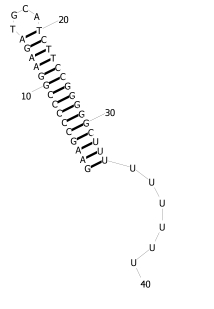
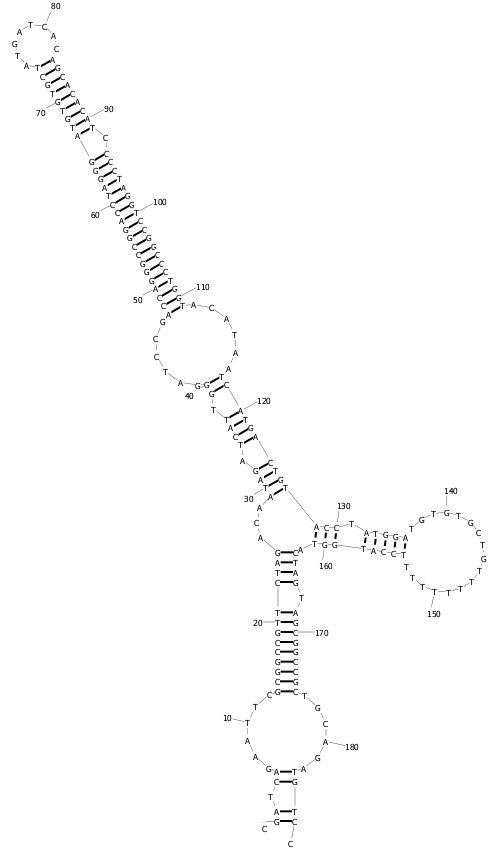
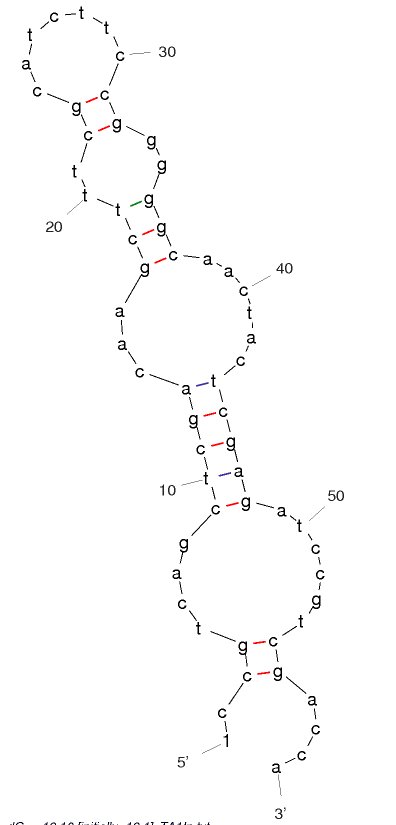
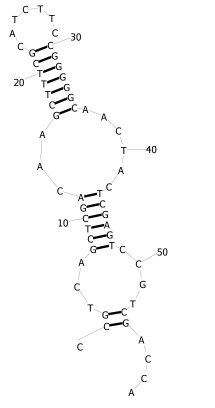
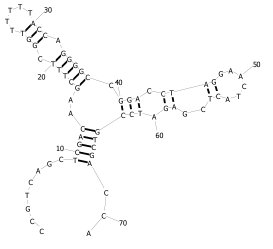
Testing both programs on the hairpin structure that will is important to this project yielded the following results:
Here, the energy according to RNAStructre was -28.5 Kcal/mole, while UNAFold predicted -28.7 Kcal/mole. The structures look identical, no I didn't just use the same picture twice. It wounds me that you would even think that. Thus far, all drawing has been done using the built in drawing function found in RNAStructure.
With the single strand folding being as similar as it is, the similarities folds done between two different sequences will be checked before going ahead with the modifications and GUI requirements.
Two Sequence Folding Comparisons
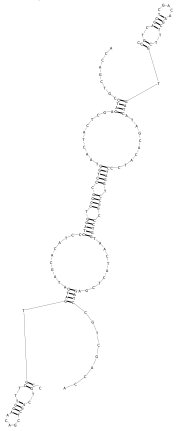
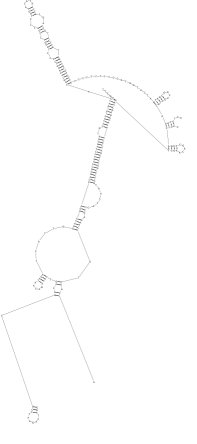
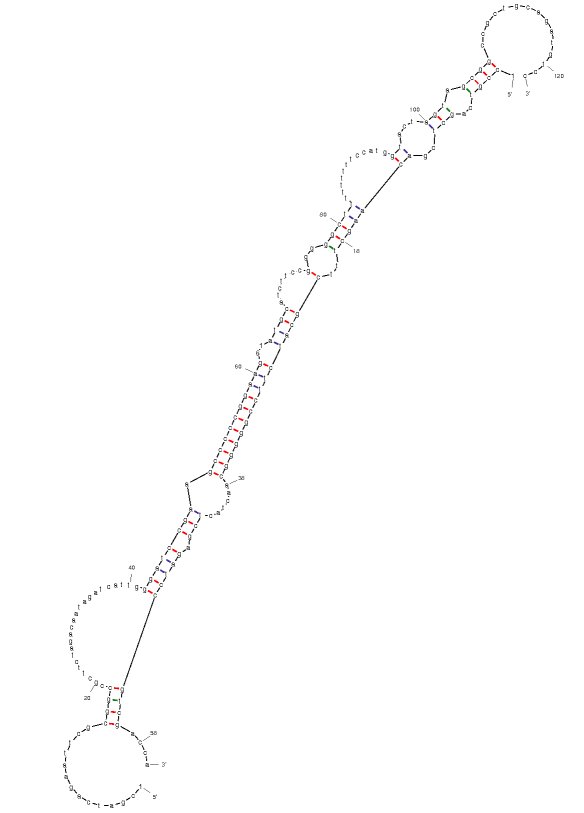
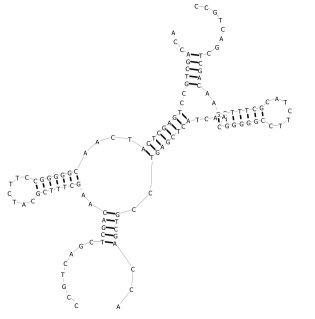
Things seem to have take a rapid downhill slide with the completion of initial testing the bimolecular folding. The sequences were chosen from the samples provided with the RNAStructure program for convenience.
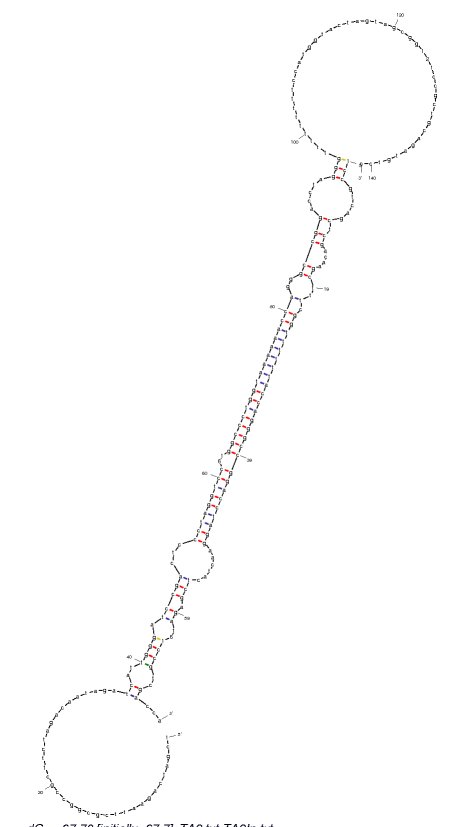
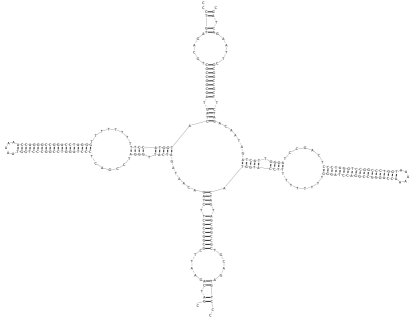
The above plots show that the estimation done with RNAstructure is much more complex than the one done with UNAFold, as the UNAFold fold assumes a shape similar to a bubble wand. The RNAstructure program estimated an energy of -130.1 kcal/mol, while the UNAFold program estimated an energy of -60.6 kcal/mol.
Gate Modeling
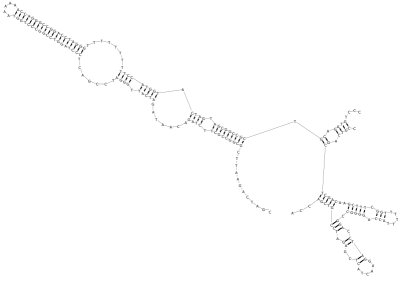
Using the UNAFold program to predict the structure of the input and output gates (TA11) resulted in:
- TA11 structure energy of -96.83
- TA11In structure energy of -14.8
- TA11 and TA11 structure energy of -182.97
- TA11In and TA11In structure energy of -34.87
- TA11 and TA11In structure energy of -91.5
Comparing this to RNAStructure which had the results:
- TA11 structure energy of -97.3
- TA11In structure energy of -13.5
- TA11 and TA11 structure energy of -207.2
- TA11In and TA11In structure energy of -39.1
- TA11 and TA11In structure energy of -125.6
Using the UNAFold program to predict the structure of the input and output gates (TA1) resulted in:
- TA1 structure energy of -57.3
- TA1In structure energy of -13.1
- TA1 and TA1 structure energy of -48.2
- TA1In and TA1In structure energy of -29.17
- TA1 and TA1In structure energy of -48.2
Comparing this to RNAStructure which had the results:
- TA1 structure energy of -59.9
- TA1In structure energy of -13.1
- TA1 and TA1 structure energy of -136.5
- TA1In and TA1In structure energy of -34.7
- TA1 and TA1In structure energy of -78.7
Using the UNAFold program to predict the structure of the input and output gates (TA2) resulted in:
- TA2 structure energy of -64.2
- TA2In structure energy of -14.9
- TA2 and TA2 structure energy of -130.17
- TA2In and TA2In structure energy of -39.47
- TA2 and TA2In structure energy of -67.7
Comparing this to RNAStructure which had the results:
- TA2 structure energy of -75.0
- TA2In structure energy of -15.8
- TA2 and TA2 structure energy of -157.8
- TA2In and TA2In structure energy of -40.7
- TA2 and TA2In structure energy of -97.2
UNAFold FrontEnd
About
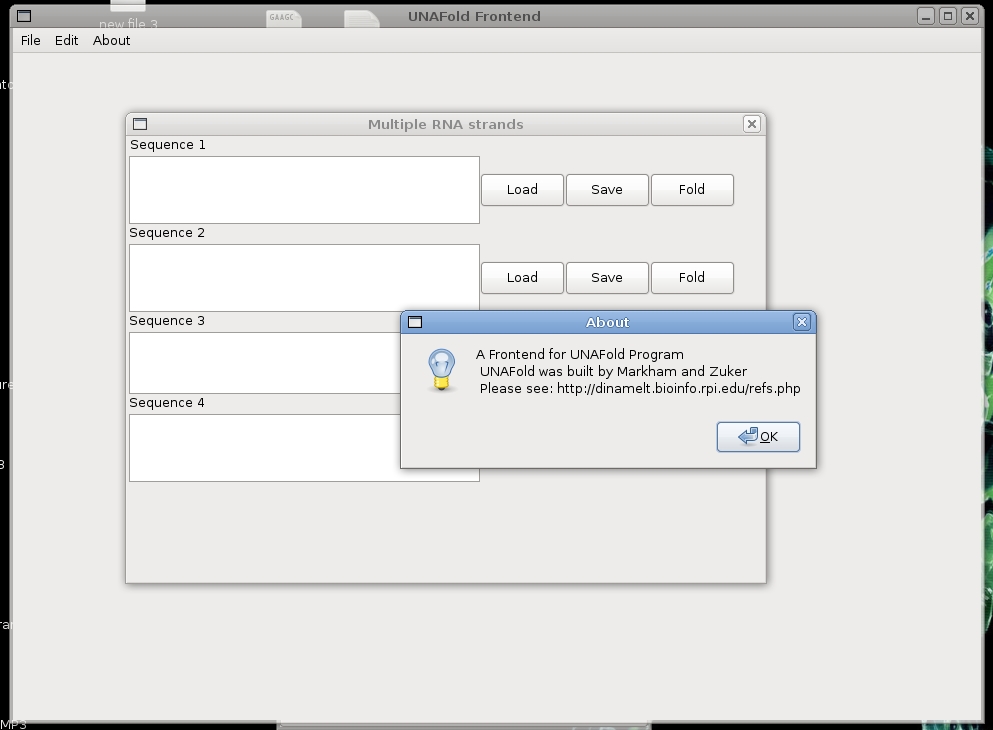
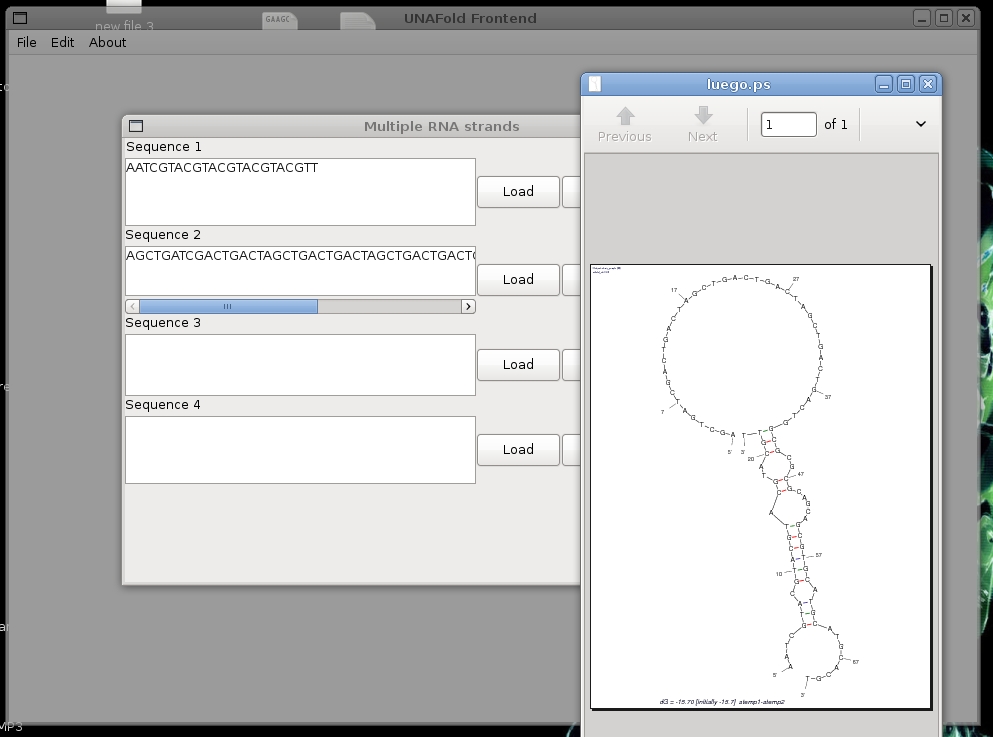
With the aims of making the RNA secondary structure easier, a front-end for the command-line program UNAFold was built.
The front-end program was built using Python and wxGlade was used to build the GUI portion. I'll get back to filling the rest of this out.
Screenshots
Stuff to Reference when Using UNAFold
- Markham, N. R. & Zuker, M. (2005) DINAMelt web server for nucleic acid melting prediction. Nucleic Acids Res., 33, W577-W581.
- Markham, N. R. & Zuker, M. (2008) UNAFold: software for nucleic acid folding and hybriziation. In Keith, J. M., editor, Bioinformatics, Volume II. Structure, Functions and Applications, number 453 in Methods in Molecular Biology, chapter 1, pages 3–31. Humana Press, Totowa, NJ. ISBN 978-1-60327-428-9.
- See for more information: http://dinamelt.bioinfo.rpi.edu/refs.php
 "
"

