Team:Heidelberg/Project/Visualization
From 2008.igem.org
(→Sensing test of Fusion Receptor with 2D Microscopy) |
(→Microscopic Screening and Quantification of 2D bacterial landscapes) |
||
| Line 483: | Line 483: | ||
After ... hours the bacteria accumulate around the plug, because they sense the established gradient of amino acids. Calculation of the mean of each image and subtraction of the background leads to a quantitative 2D representation of the bacterial density landscape. ??? This data can be compared to modeling results ??? | After ... hours the bacteria accumulate around the plug, because they sense the established gradient of amino acids. Calculation of the mean of each image and subtraction of the background leads to a quantitative 2D representation of the bacterial density landscape. ??? This data can be compared to modeling results ??? | ||
| - | Remark: The scans are taken from two different experiments due to the difficult adjustment of a constant focus. | + | Remark: The scans are taken from two different experiments with equal settings due to the difficult adjustment of a constant focus. |
{| class="wikitable" | {| class="wikitable" | ||
Revision as of 17:51, 28 October 2008


Contents |
Killing - Colicin
Time series of killer and prey bacteria over 48 hours. Killer cells are marked with mCherry (red) and prey bacteria are marked with GFP (green). The intial ratio is 1:1, which can be recognized on the second and third frame (8h and 12h, respectively). Many prey and killer bacteria are grown after 36 hours (last three image frames). However, the faint green fluorescence (it is sharp!) indicates the weak prey metabolism due to the toxin. Toxin production and excretion is activated in killer bacteria by the signaling molecule autoinducer-1.
To see separate images click here
Microscopic Screening and Quantification of 2D bacterial landscapes
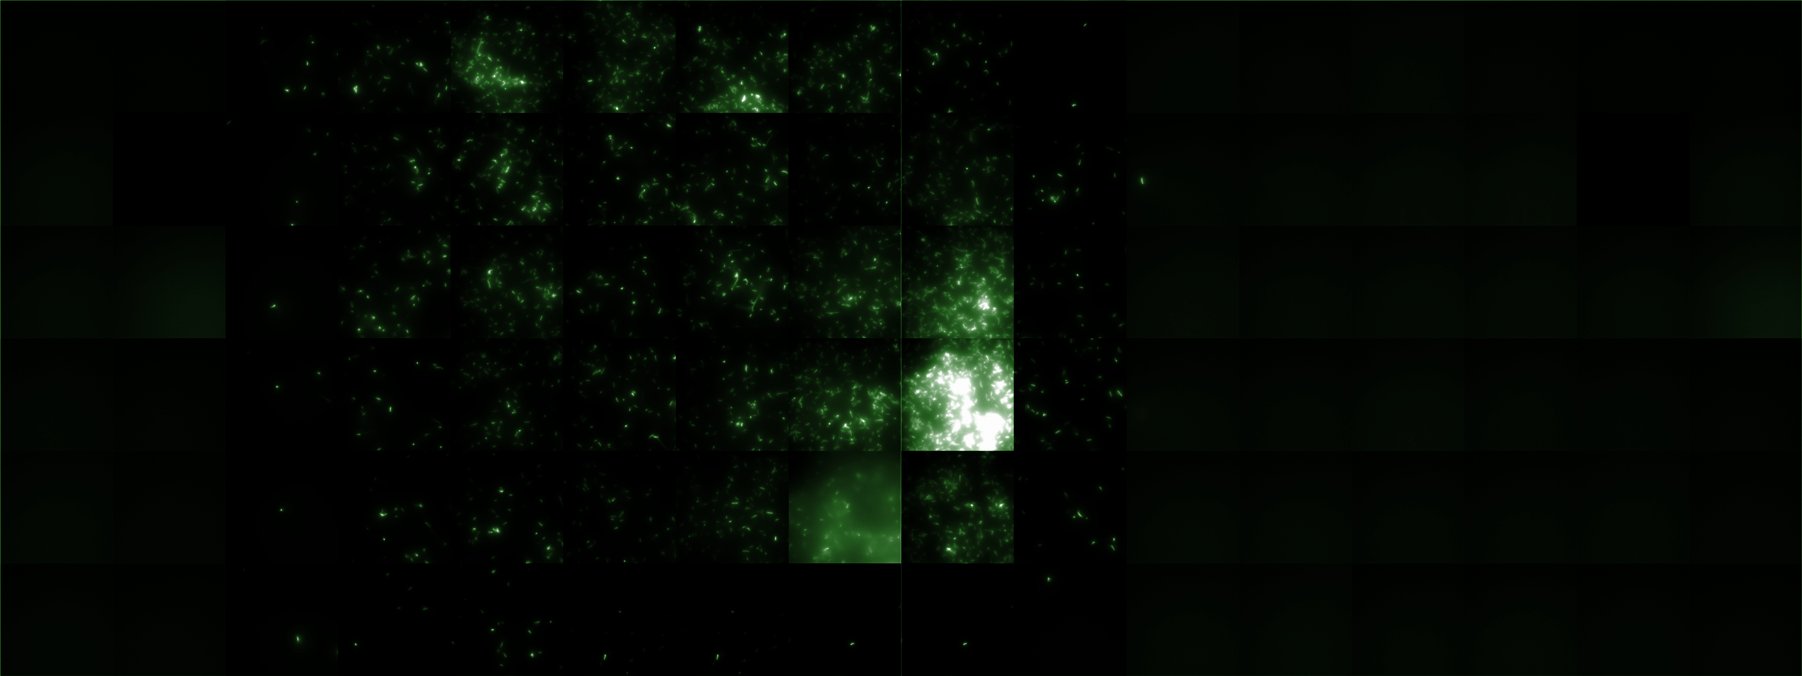
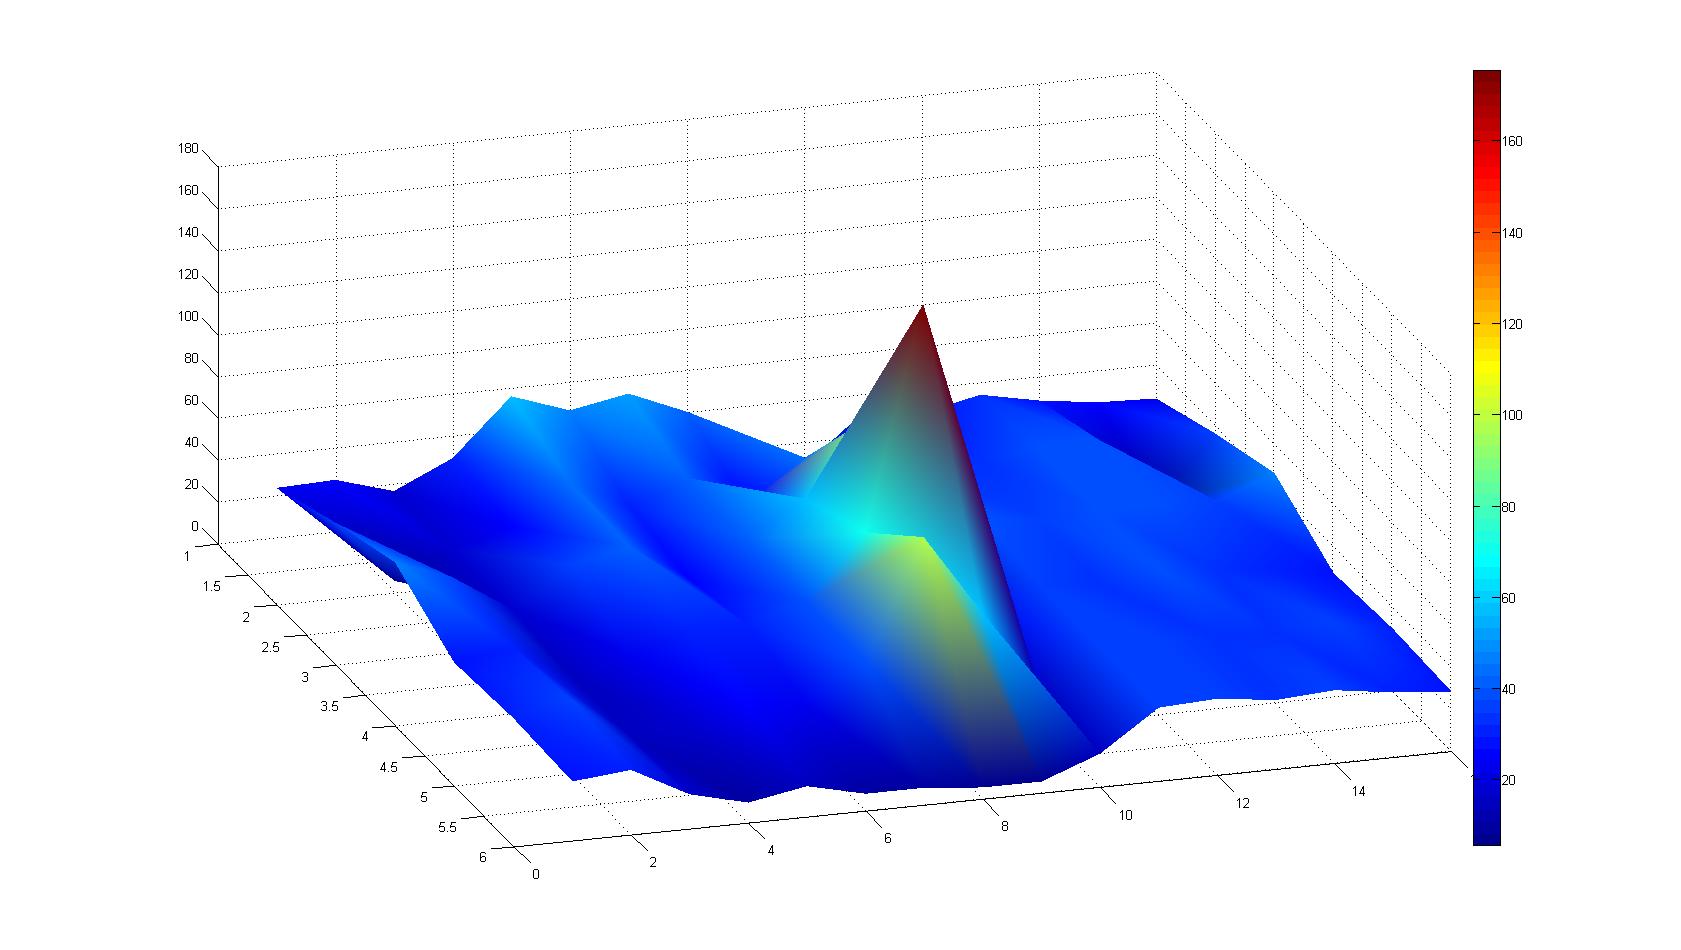
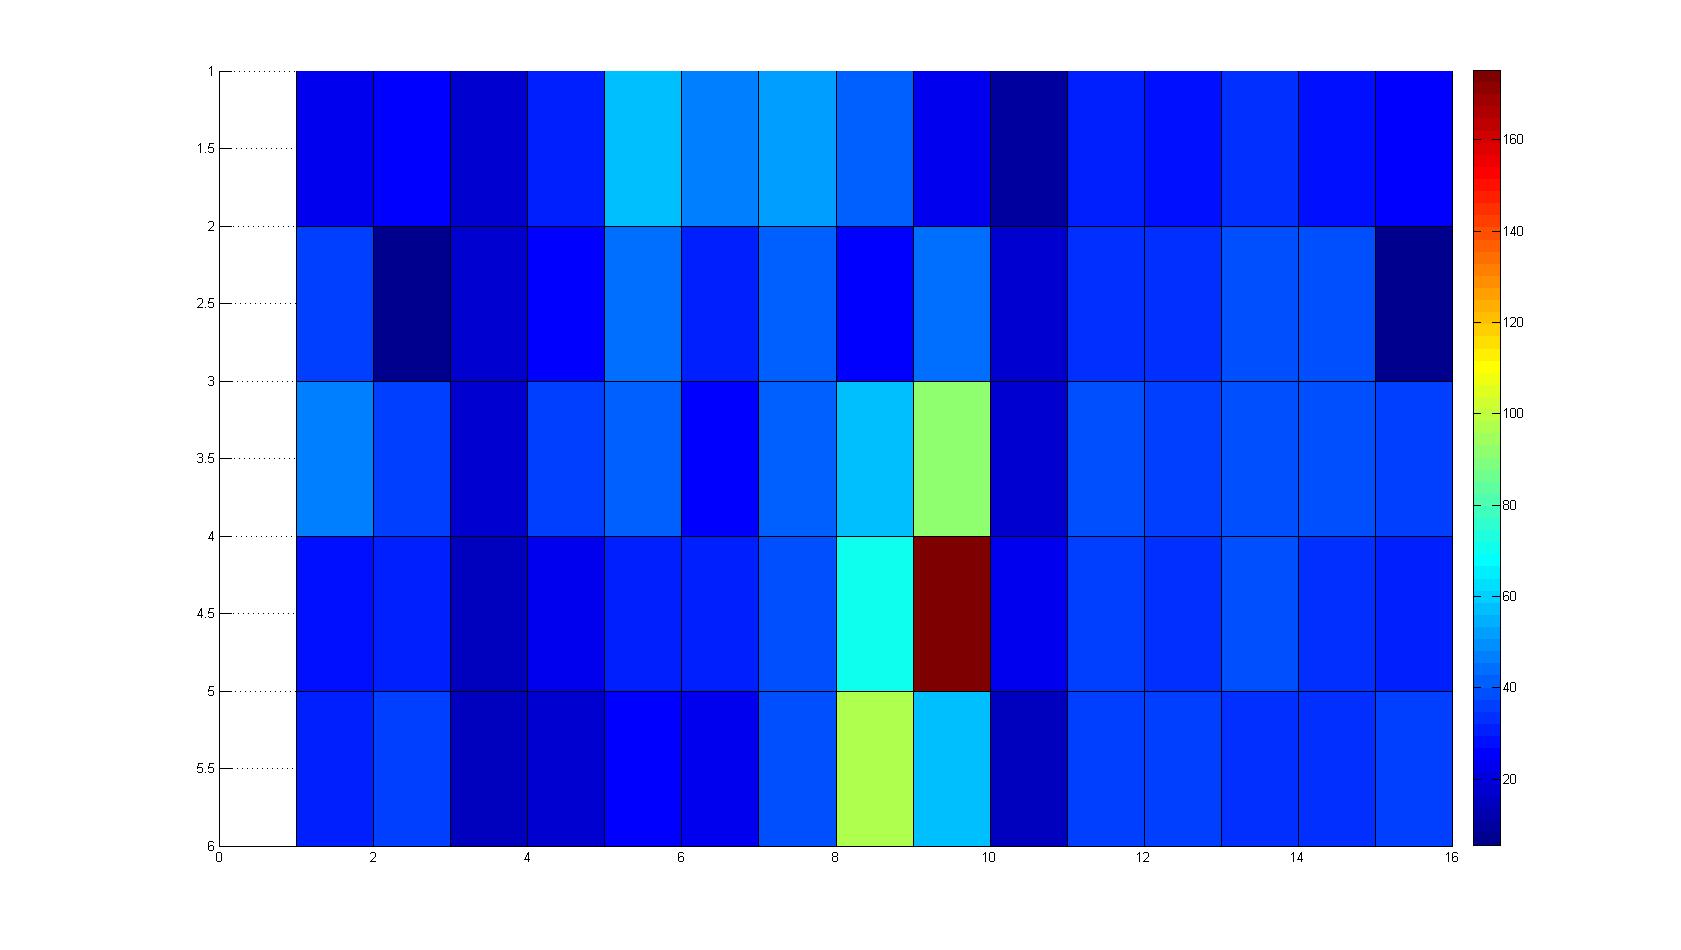
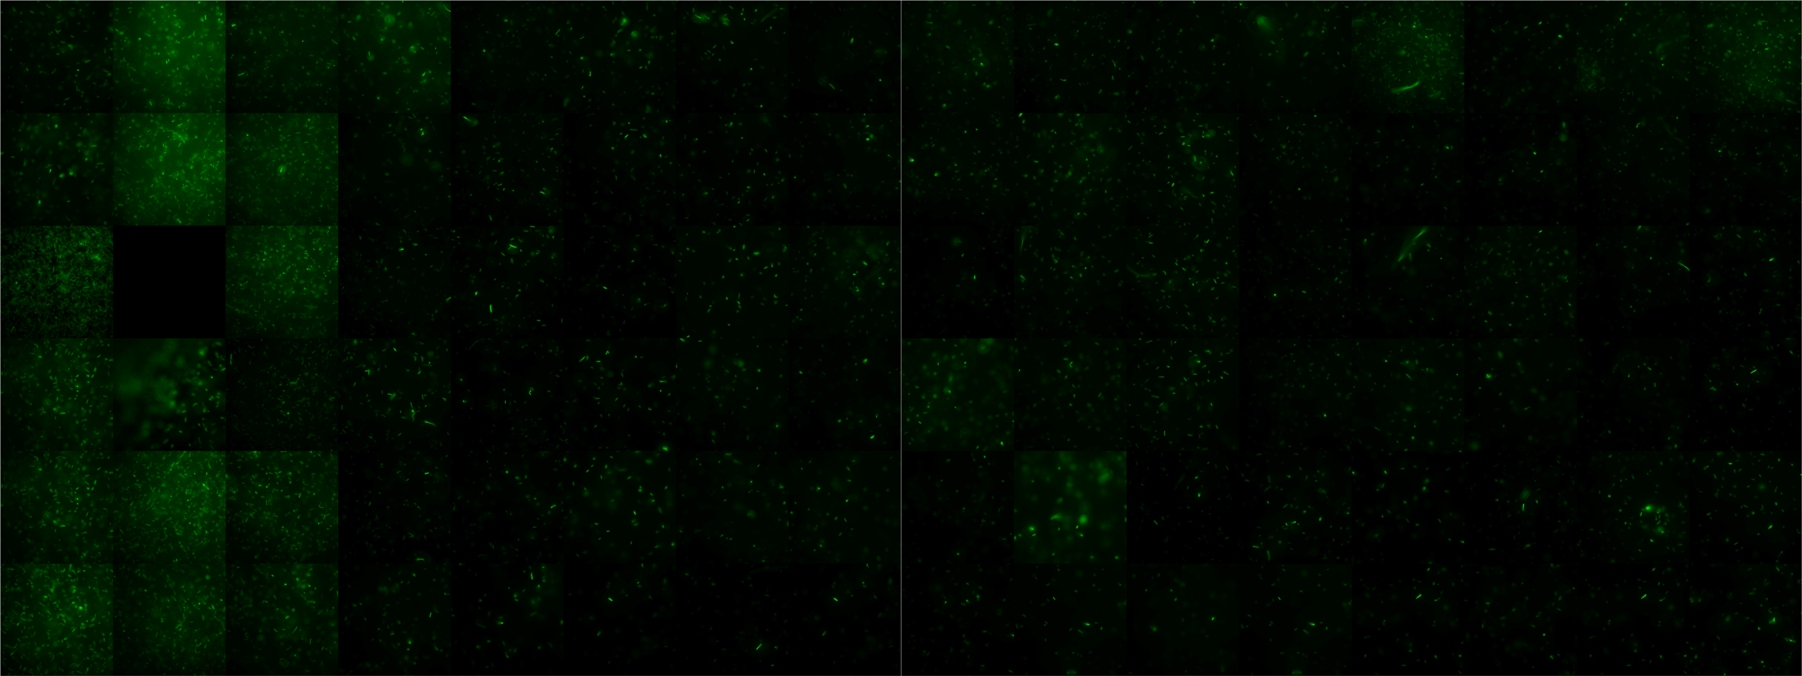
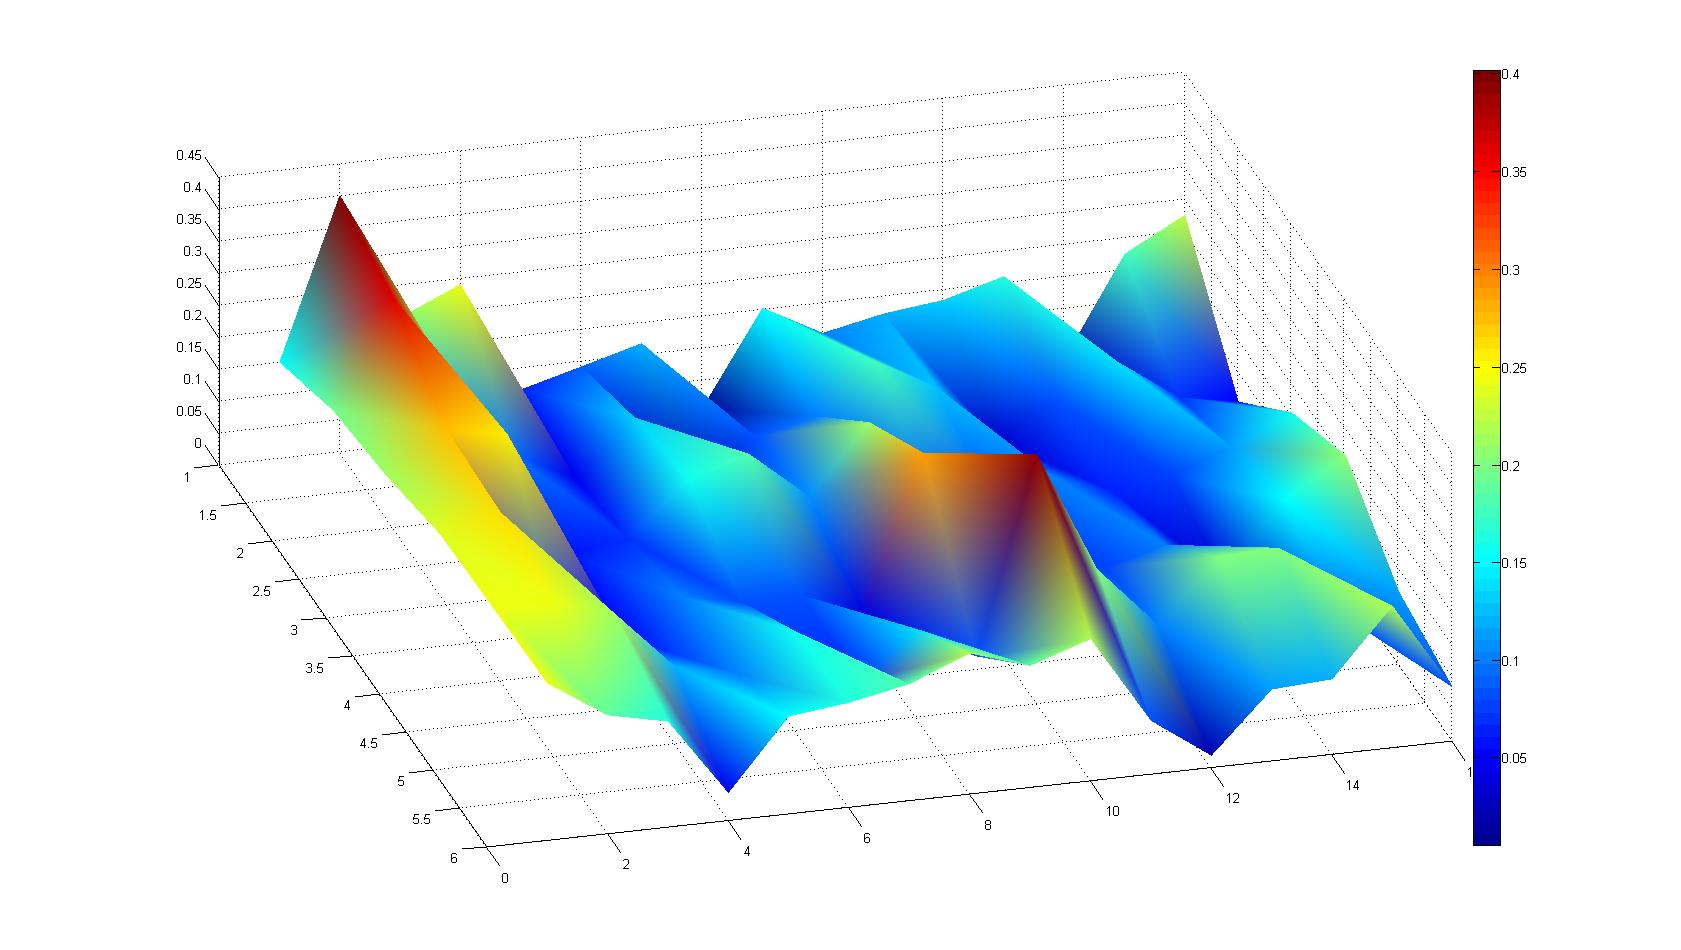
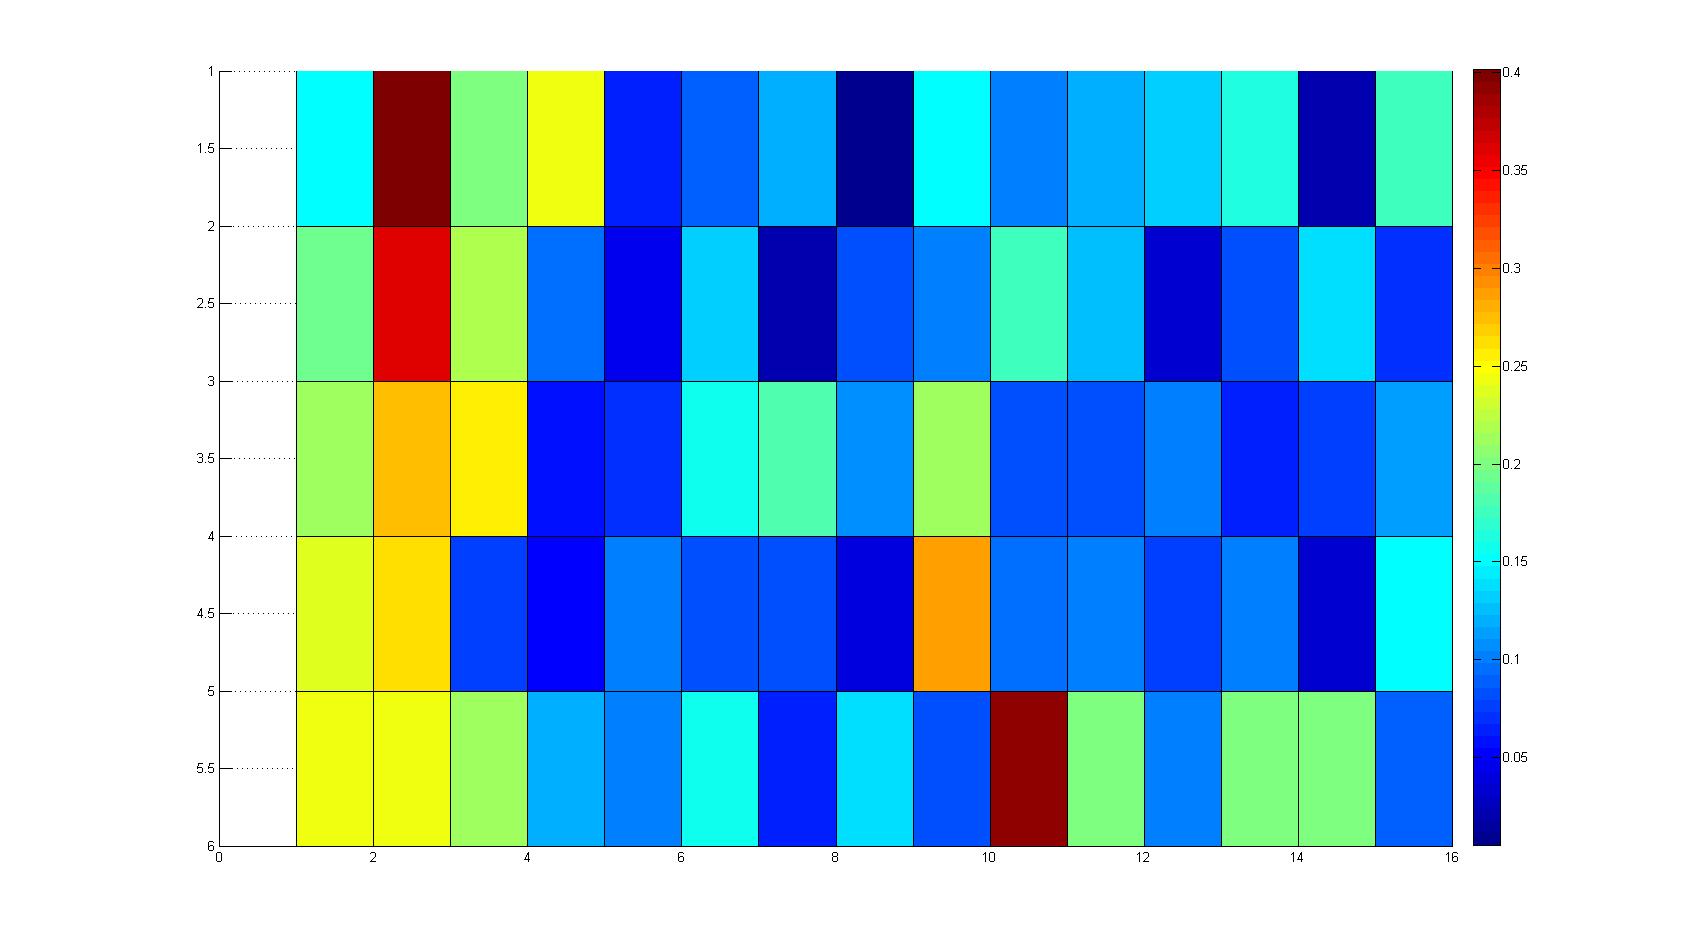
Screening of bacterial density in soft agar chamber. For a proof of principle the chemotactic strain HCB33 is applied to the middle of the chamber. On the left side of the chamber is a 2% agar plug containing 10% of casamino acids. After ... hours the bacteria accumulate around the plug, because they sense the established gradient of amino acids. Calculation of the mean of each image and subtraction of the background leads to a quantitative 2D representation of the bacterial density landscape. ??? This data can be compared to modeling results ???
Remark: The scans are taken from two different experiments with equal settings due to the difficult adjustment of a constant focus.
 "
"
