Team:Brown/Project/Analysis
From 2008.igem.org
(Difference between revisions)
| Line 51: | Line 51: | ||
==NaCl Testing== | ==NaCl Testing== | ||
| - | * Multiple "Salt Tests" were performed to determine the exact sensitivity of our apparatus. | + | * Multiple "Salt Tests" were performed to determine the exact sensitivity of our apparatus. |
| + | Salt concentrations originally tested are listed below. Further tests are to be run where the greatest resistance jump occurred to determine the exact concentration needed to see a significant resistance decrease due to cell lysis. | ||
| + | Molarity (M): | ||
| + | # .000005 | ||
| + | # .00001 | ||
| + | # .00005 | ||
| + | # .0001 | ||
| + | # .0005 | ||
| + | # .001 | ||
| + | # .005 | ||
| + | # .01 | ||
| + | # .05 | ||
| + | # .1 | ||
| + | |||
==Resistance Testing== | ==Resistance Testing== | ||
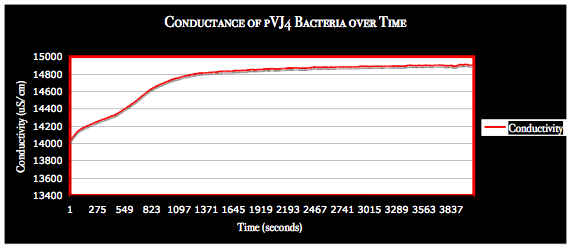
* This test was done with 50X concentrated pVJ4 E. coli bacteria resuspended in M9 Minimal Media. Cultures were left overnight. | * This test was done with 50X concentrated pVJ4 E. coli bacteria resuspended in M9 Minimal Media. Cultures were left overnight. | ||
Revision as of 06:20, 29 October 2008
Optical Density
Each culture was originally grown into the stationary phase and then diluted to the mid-log phase. The E. coli cells experience greatest growth in the Mid-Log phase. Arabinose was added while cells were in this phase which provided the quickest protein expression and resulting lysis.
NaCl Testing
Salt concentrations originally tested are listed below. Further tests are to be run where the greatest resistance jump occurred to determine the exact concentration needed to see a significant resistance decrease due to cell lysis. Molarity (M):
Resistance Testing
Conductivity Testing
|
 "
"


