Team:Heidelberg/Notebook/Killing II/12thweek
From 2008.igem.org


12th week
Contents |
Monday 10/20/2008
pSB1A3-Receiver-Colicin cloning
- Minipreps of colE1/E9/E9lys-Receiver with QiaCube, Qiagen
- Send probes to GATC for sequencing
Sender cloning: constitutive promotor-sender
- Minipreps of J23107-Receiver with QiaCube, Qiagen
- Send probe to GATC for sequencing
[back]
Tuesday 10/21/2008
Sequencing results of ready cloned BioBrick parts
| EcoRI-site mutation | PstI-site 1 mutation | PstI-site 2 mutation | PstI-site 3 mutation | Prefix | Suffix | complete sequence | |
|---|---|---|---|---|---|---|---|
| colE1_BB_57-1 | + | + | + | + | + | + | + |
| colE1_BB_57-2 | + | + | + | + | + | + | + |
| colE1_BB_57+2 | ? | + | + | ? | + | ? | missing sequence |
| colE1_BB_67+1 | + | + | + | + | + | ? | sequencing failure |
| colE9_BB_(2) | + | XXX | XXX | XXX | + | + | + |
| colE9lys_BB | XXX | XXX | XXX | XXX | + | + | + |
| sender_BB | XXX | XXX | XXX | XXX | + | + | + |
--> colE1_BB_57-1, colE9_BB_(2), colE9lys_BB and sender_BB gave positive sequencing results in all criteria and will be sent to the registry
Controldigestion of parts with EcoRI and PstI
- colE1_BB_57-1, colE9_BB_(2), colE9lys_BB and sender_BB was digested with EcoRI and PstI: 1h 30 min -> 37 °C
 0.5 µl EcoRI (NEB)
 0.5 µl PstI (NEB)
 3.0 µl DNA
 2.0 µl EcoRI Buffer (NEB)
 2.0 µl BSA 10x
12.0 µl H2O
-------
20.0 µl
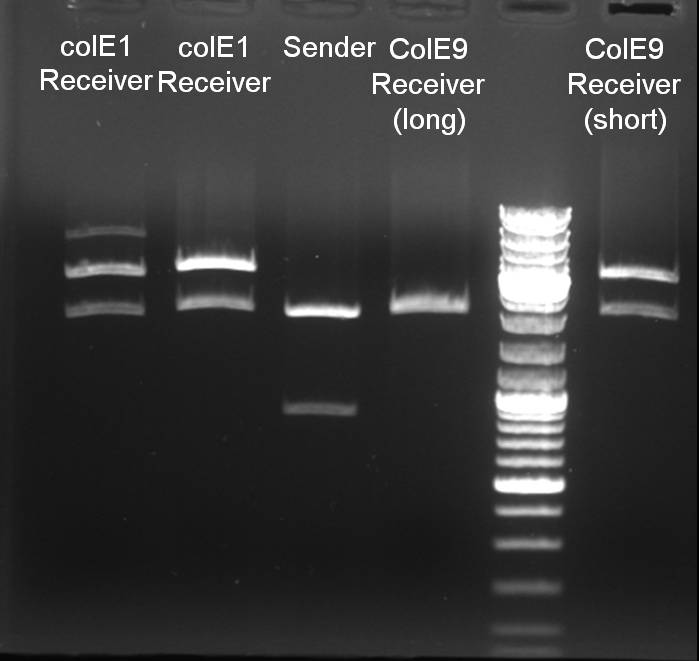
- Gelresults: The digestion pattern looks like expected. 1% Agarose, 135 V, 30 min
Control of antibiotics resistance
- LB-media containing tetracycline, chloramphenicol, ampicilin or kanamycin was inoculated with the different parts to the theri antibiotics resistance.
[back]
Wednesday 10/22/2008
- Antibiotics test: Each part only grew in ampicilin media as expected
- packaging and shipping of all standardized BioBrick parts to MIT
Characterization: Colicin activity test
After adjustment of the OD of the different cultures (killer, reference killer, prey), mixtures of different rations were done and transfered to a 96 well plate for ON measurement after following schemes
[back]
Thursday 10/23/2008
Results of the colicin activity test
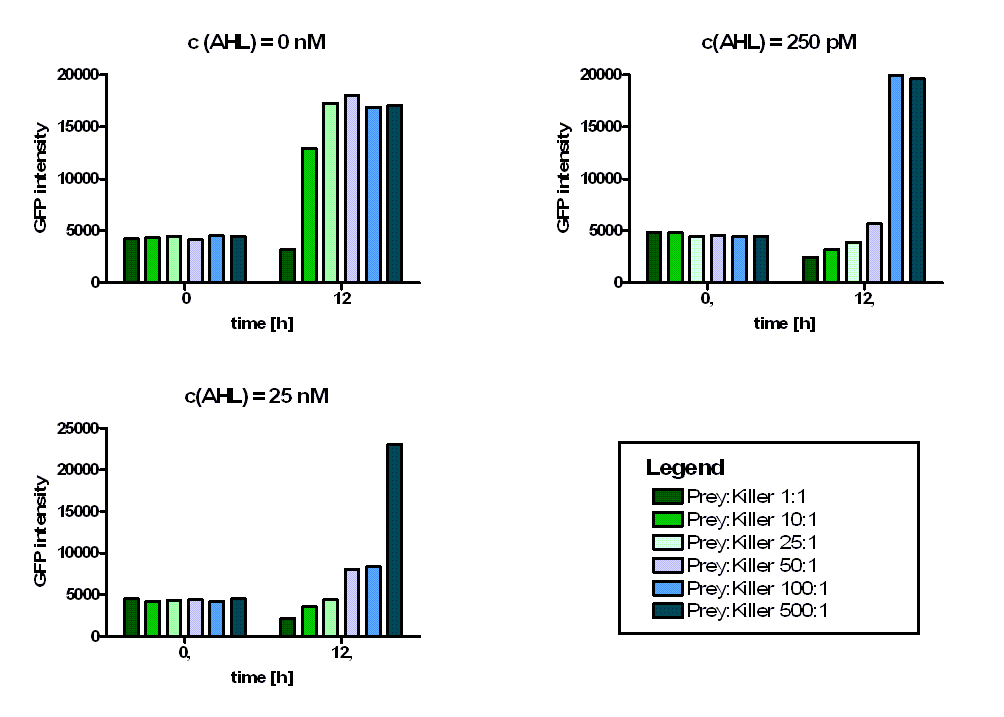
The bar diagrams above show, that in case of a mixture ratio of 1:1 even for uninduced killer cells (i.e. a AHL concentration of 0 nM) a killing affect can be observed. In case of an AHL concentration of 250 pM, the lowest mixture ratio of killer:prey leading to an observable killing effect seems to be 1:50. That means, at an AHL concentration of 250 pM, one single killer cell is able to kill 50 prey cells. In case of an AHL concentration of 25 nM, this threshold rations rise up to killer:prey = 1:100. That means, for a higher induction level of the killer cells, the killing efficiency, i.e. the amount of released colicins, rises. For a mixture ration of killer:prey = 1:500 even at a AHL concentration of 25 nM no killing effect could be observed.
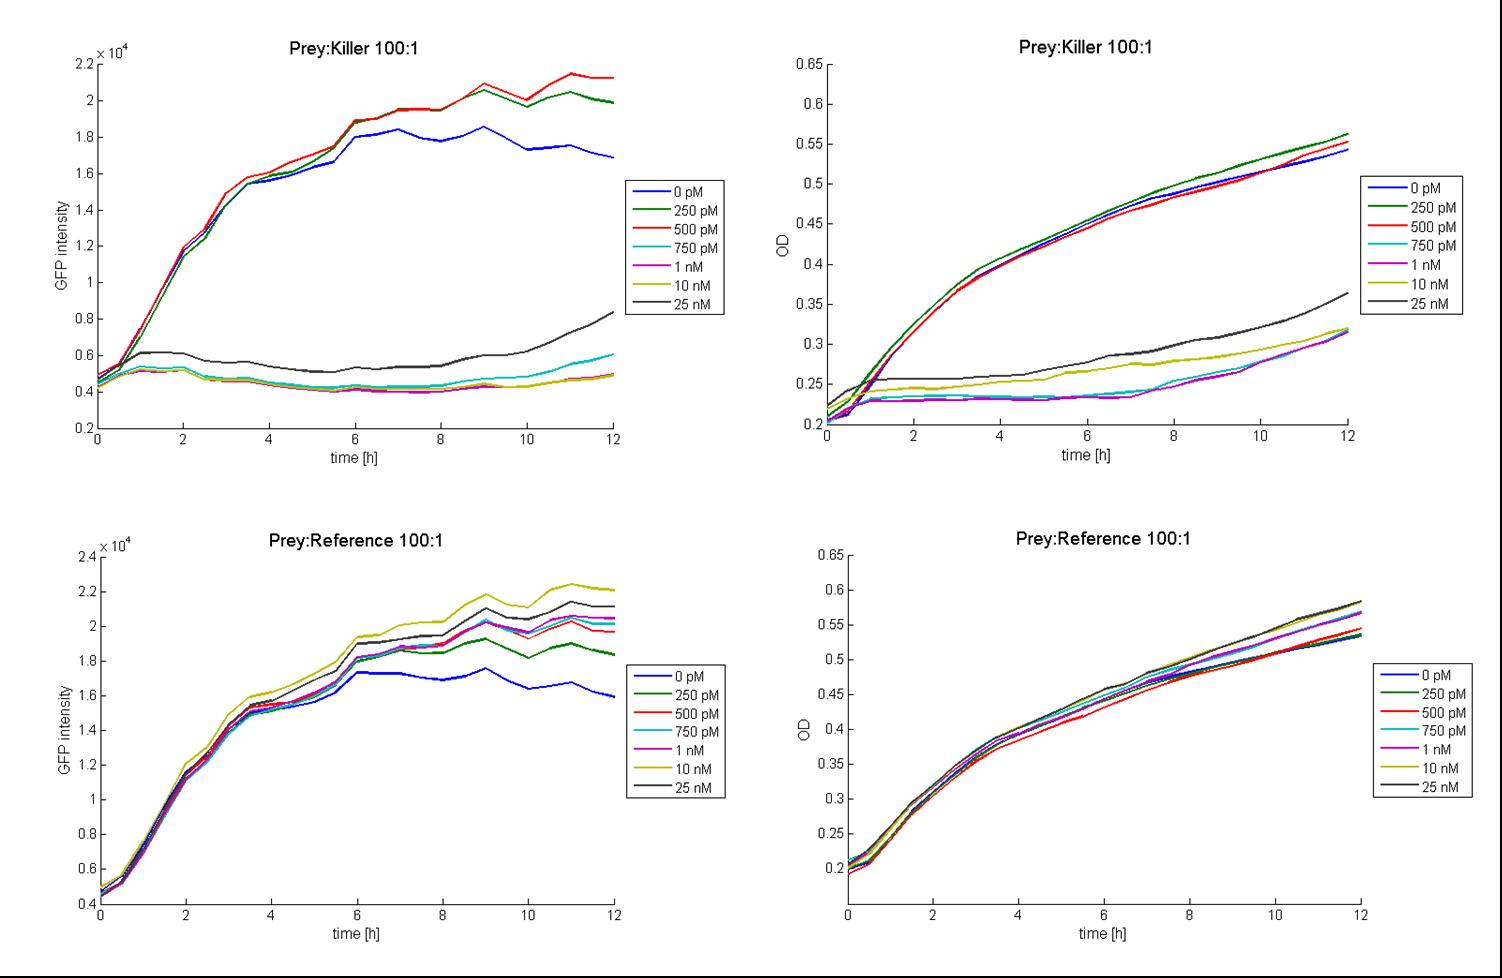
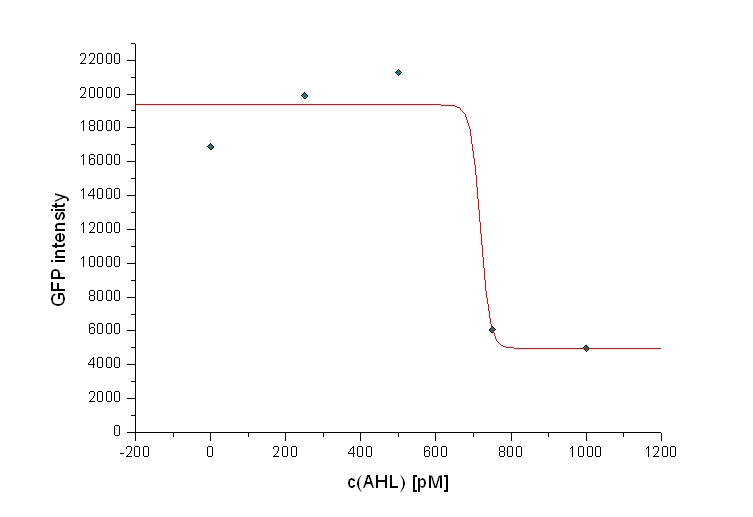
The figure above shows the GFP vs time and OD vs time curves for prey:killer and prey:reference respectively, each at a mixture ratio of 100:1. The figures for prey:killer (GFP as well as OD) shows, that there is an observable killing effect for the AHL concentrations of 750 pM and above. For the concentrations 500 pM and lower, no killing effect could be observed, that means, the GFP and the OD respectively rise in the same matter, than they do for the prey:reference curves. This is due to a continuous growth of the prey cells (expressing GFP) because of a lack of colicin in the media. According to this results, the threshold AHL concentration for an observable killing effect in the case of a prey:killer ratio of 100:1 seems to be between 500 pM and 750 pM (see dose-response curve for this prey-killer ratio below).
[back]
Friday 10/24/2008
Sender activity test
Constitutive sender and amplifier ([http://partsregistry.org/Part:BBa_I15030 BBa_I15030]) activity test
- over the day:
- 7x Inoculation of 8 ml TB media with 160 µl from sender ONC
- 7x Inoculation of 8 ml TB media with 160 µl from amplifier ONC
- Inoculation of 7 ml TB media with 7 ml from GFP-receiver ONC
- every hour (starting at t = 0 h until t = 7 h)
- Measurement of optical density (OD) of ONC dilutions
- Two different adequate dilutions of the diluted ONC were plate on LB Agar plates for cfu determination
- Creation of supernatant of the measured probe by sterile filtration (storage of the supernatant at 4 °C)
- evening: Measurement of the amount of produced AHL in the supernatants of the different timepoints
- each: 400 µl of the respective supernatant + 400 µl fresh TB media + 200 µl T9002 cells
- reference: T9002 cells + different concentrations of AHL
- plate scheme:
[back]
Saturday 10/25/2008
Results of the Sender activity test
Characterization: ColicinE1-Receiver Activitytest: Killer-prey system test and lysis test of killer cells
- afternoon: Inoculation of the following cultures:
- constitutive Sender with GFP(J23107-F1610 + I20260)(TB-Kana_Amp)
- ColE1Rec pBAD-mCherry (TB-Kana-Amp-Arab)
- T9002 without GFP pBAD-mCherry (TB-Kana-Amp-Arab)
- ColE1Rec + I20260 (TB-Kana-Amp)
- T9002 without GFP + I20260 (TB-Kana-Amp)
- 8.30 pm: Preparing mixtures for the plate:
- for colE1-Receiver killer-prey test (left part of the plate):
- 1:4 100 µl Sender + 400 µl Receivercells
- 1:1 100 µl Sender + 100 µl Receivercells + 300 µl TB media
- 5:1 100 µl Sender + 20 µl Receivercells + 380 µl TB media
- 10:1 100 µl Sender + 10 µl Receivercells + 390 µl TB media
- 25:1 100 µl Sender + 4 µl Receivercells + 396 µl TB media
- 50:1 100 µl Sender + 2 µl Receivercells + 398 µl TB media
- 100:1 100 µl Sender + 0.4 µl Receivercells + 400 µl TB media
- for colE1-Receiver lysis test (right part of the plate)
- colE1 + I20260: 250 µl colE1 cells + 250 µl TB-Amp-Kana
- T9002 without GFP + I20260: 250 µl T9002 without GFP + I20260 cells + 250 µl TB-Amp-Kana
- plate scheme:
Theoretical work for documentation
[back]
Sunday 10/26/2008
Theoretical work for documentation.
[back]
 "
"


