Team:ETH Zurich/Modeling/Genome-Scale Model
From 2008.igem.org
Genome Scale AnalysisIn the Restriction Enzymes Analysis modeling section we deal with the analysis of restriction enzymes effects on the genome from the simple point of view of nucleotide sequences and cutting patterns. This is not informative enough when we try to understand if the key principles of reduction and selection at the base of our minimal genome approach are valid in the context of the whole cell response. It is evident that our selection method for smaller genome size strains is based on the assumption that is possible to control growth rate as a function of its genome size. As explained in the Project Overview, we put a selective pressure on the genome size by combining two effects together: the random reduction of the genome size by restriction enzymes cutting and the feeding of a limited amount of thymidine nucleotides on the background of a thymidine auxotrophic strain. In this context, one should also consider the effects that the lost of chromosomal coding regions may have on the physiology of the cell. This scenario needs to be validate using modeling techniques that relate genome content and substrates avaiability with cell physiology, on a system level fashion. Fortunately, in the last ten year huge progress have been achieved in coding our understanding of biological networks into whole cell comprehensive stochiometric models. This model typology is called genome scale modeling and we use the most update genome scale model for our working strain (E.Coli K12 MG1655) in order to answer the following questions:
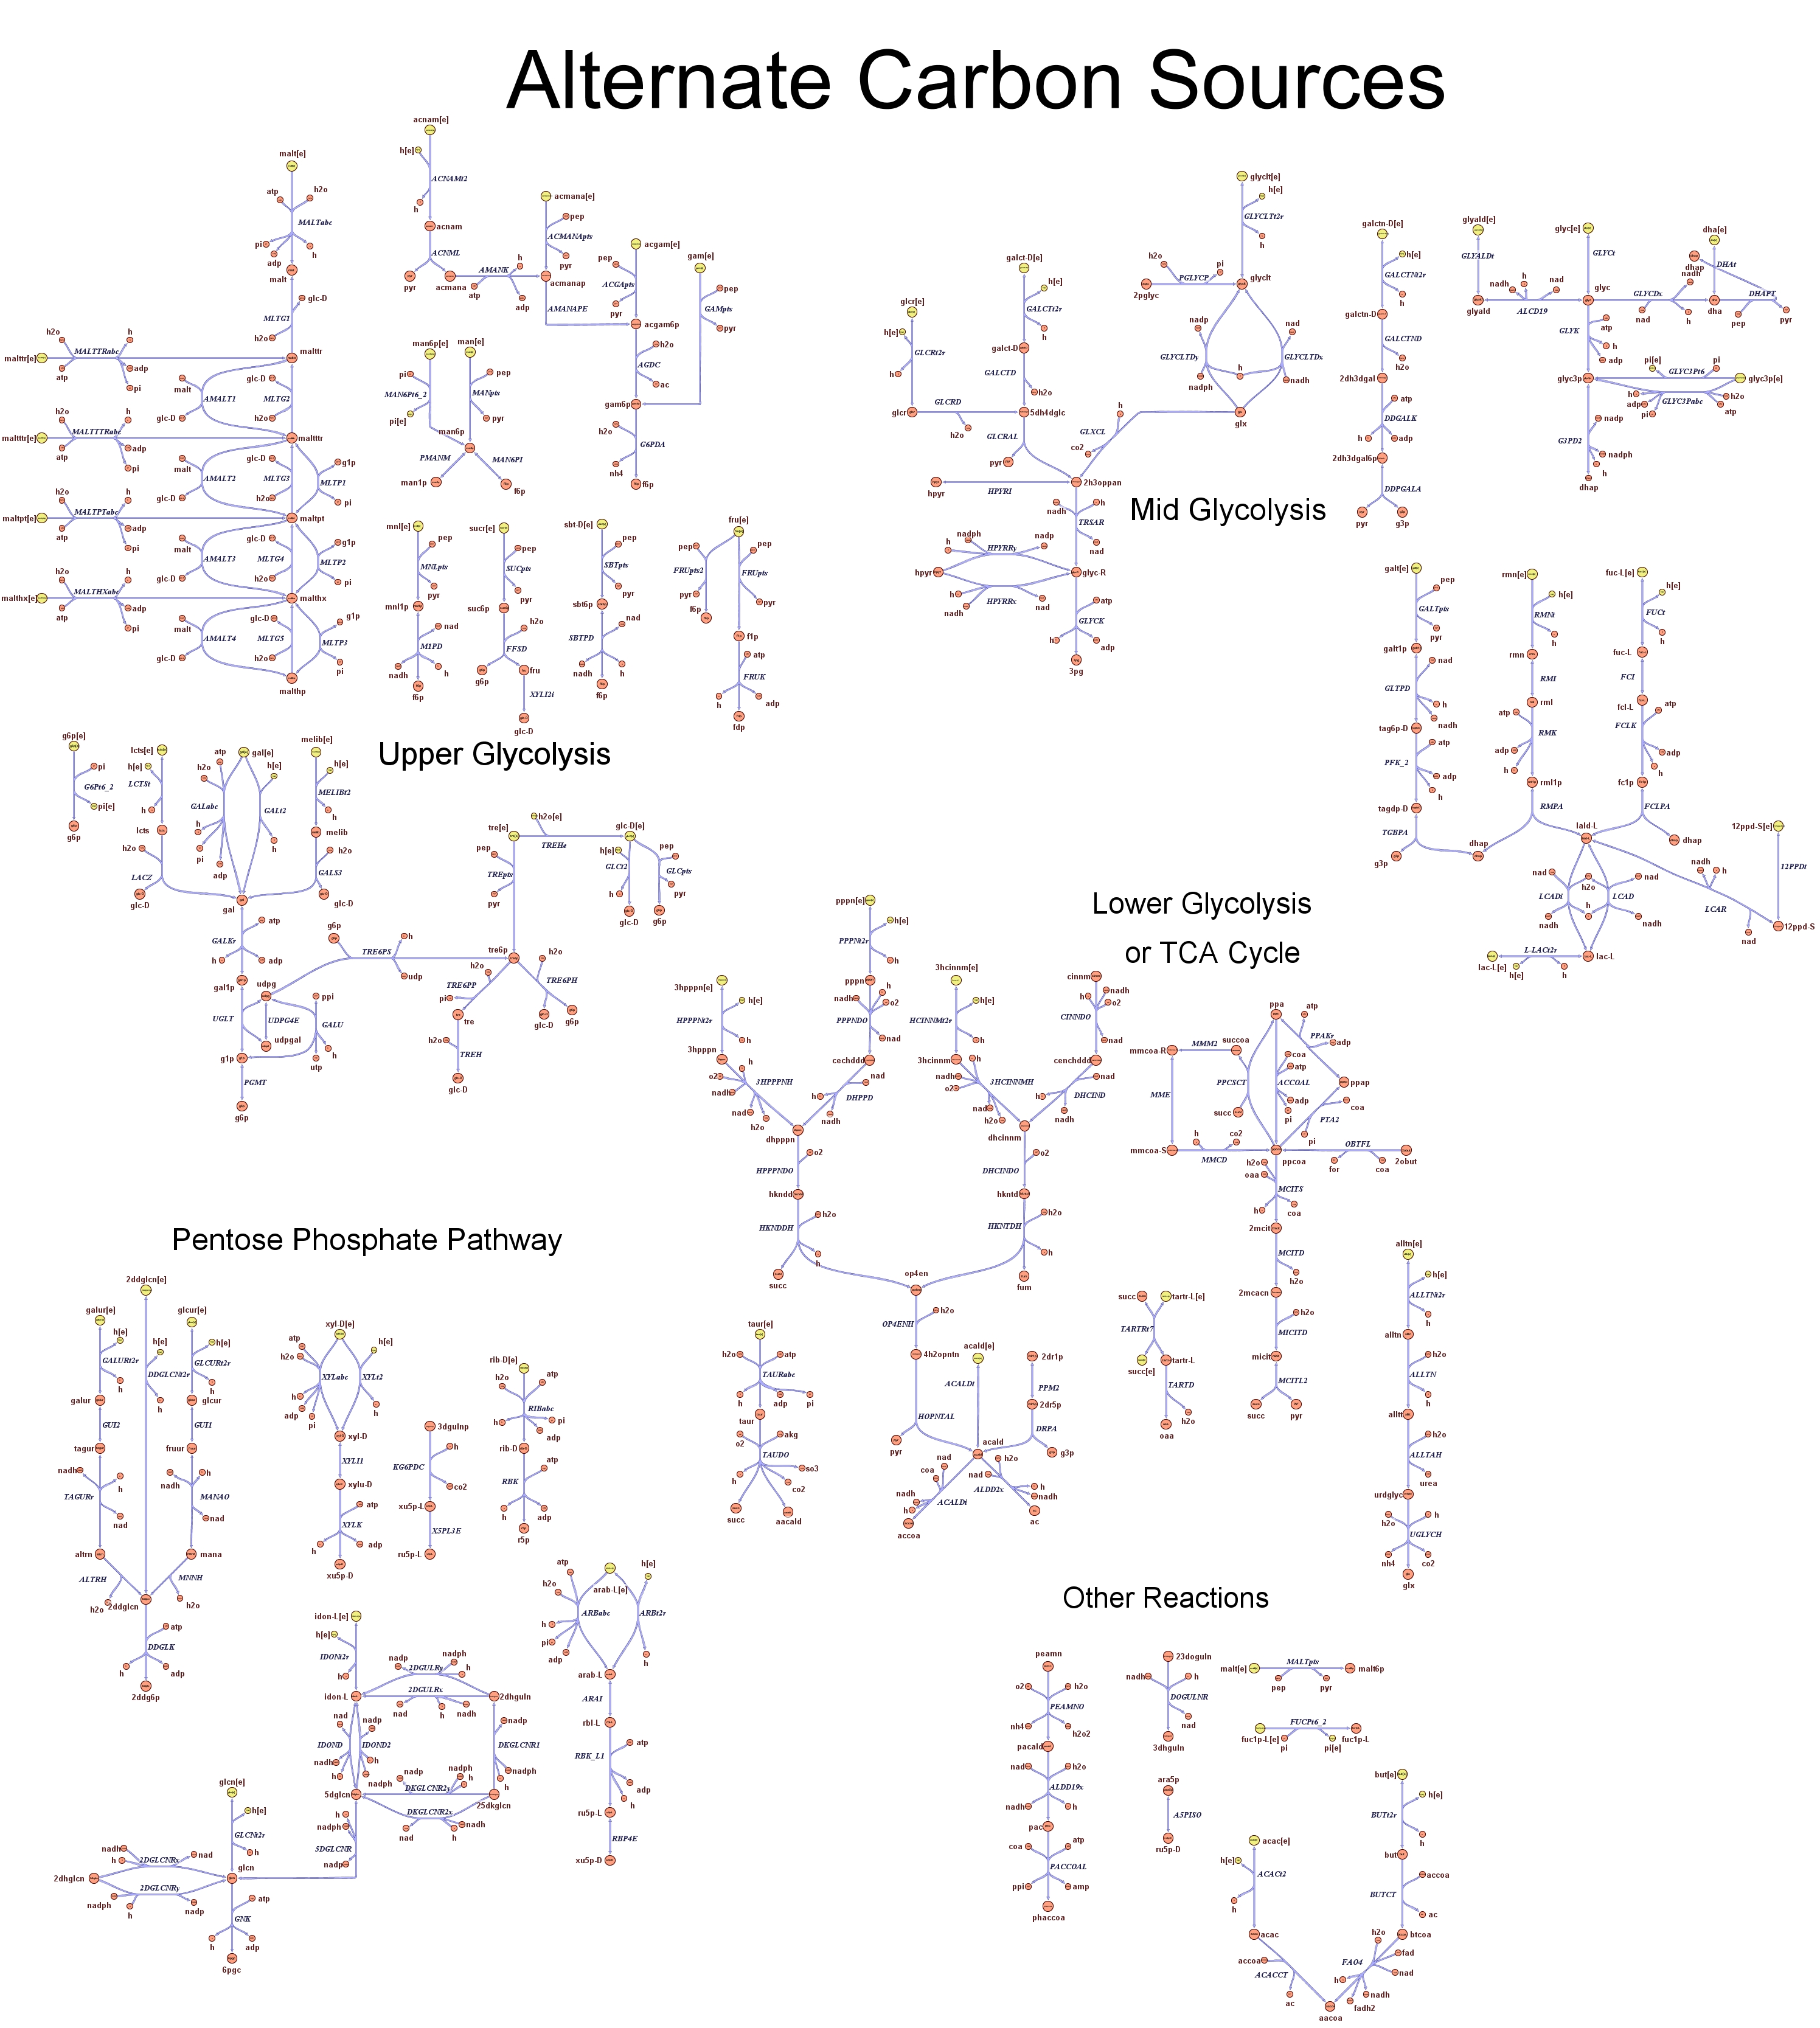
These questions are answered below, in the respective sections. As first we introduce the genome scale model concepts, the Flux Balance Analysis theory and in particular the iAF1260 E.Coli Genome Scale Model developed by [http://gcrg.ucsd.edu/|the Palsson's Group at UCSD], that we modified and used. In the following sections we show the results of simulations for the different questions to be answered. Genome Scale Models, FBA and E.Coli K12 MG1655Genome scale models (1) are biological network reconstructions that effectively mape genome annotations (ORFs) to biochemical reactions that define the metabolic network specific to a particular organism. They are also called stoichiometric models because encode calculation of quantitative relationships of the reactants and products in the balanced biochemical reactions in the organism. When they are enough informative to cover a consistent part of the known organism functions are called in-silico organisms, bacause it is possible to use them as models to simulate whole cell system responses. Genome scale models are used in combination with Flux Balance Analysis in order to predict the physiology (growth rate, uptake rates, yields etc..) of the in-silico organism depending on variable external nutrient conditions or changes in genome composition (in-silico knockout experiments). In the last decade this modelling technique has proved to give consistent results with experimental data under various hetereogeneous conditions of testing (4). Mathematically, Flux Balance Analysis uses the stoichiometric information in order to predict the metabolic flux distribution under the assumption of maximization of a particular cell process (for example maximizing biomass production). If N is the stochiometric matrix, and V the vector of fluxes, Flux Balance Analysis assumes steady state: And then compute a flux solution according to a maximization (or the correspective minimization) function: Once the metabolic fluxes are known, is possible to calculate physiology parameters. For a complete introduction to these concepts please read this [http://www.nature.com/nbt/web_extras/supp_info/nbt0201_125/info_frame.html| Genome Scale Models introduction].
Different mediumsAs explained in the Project Overview section, the minimal genome, apart that can be not unique, is also very dependent on the enviromental conditions. In particular bacteria have evolved a complex system of regulation in order to express genes depending on the avaiability of one or the other substrate. So, it results intuitive that both the size and the identity of genes in the minimal genome will vary of a certain (probably significant) extent. In order to test this prediction using genome scale models, we prepared two different in-silico medium on which to grow our models. One is a very rich medium that simulates (as guideline) the content of LB medium, apart from the nucleotides that are not present in order to not disturb the selection mechanism. The other is a minimal medium that has glucose as carbon source. Here below we report the composition of our in-silico mediums and their avaiability:
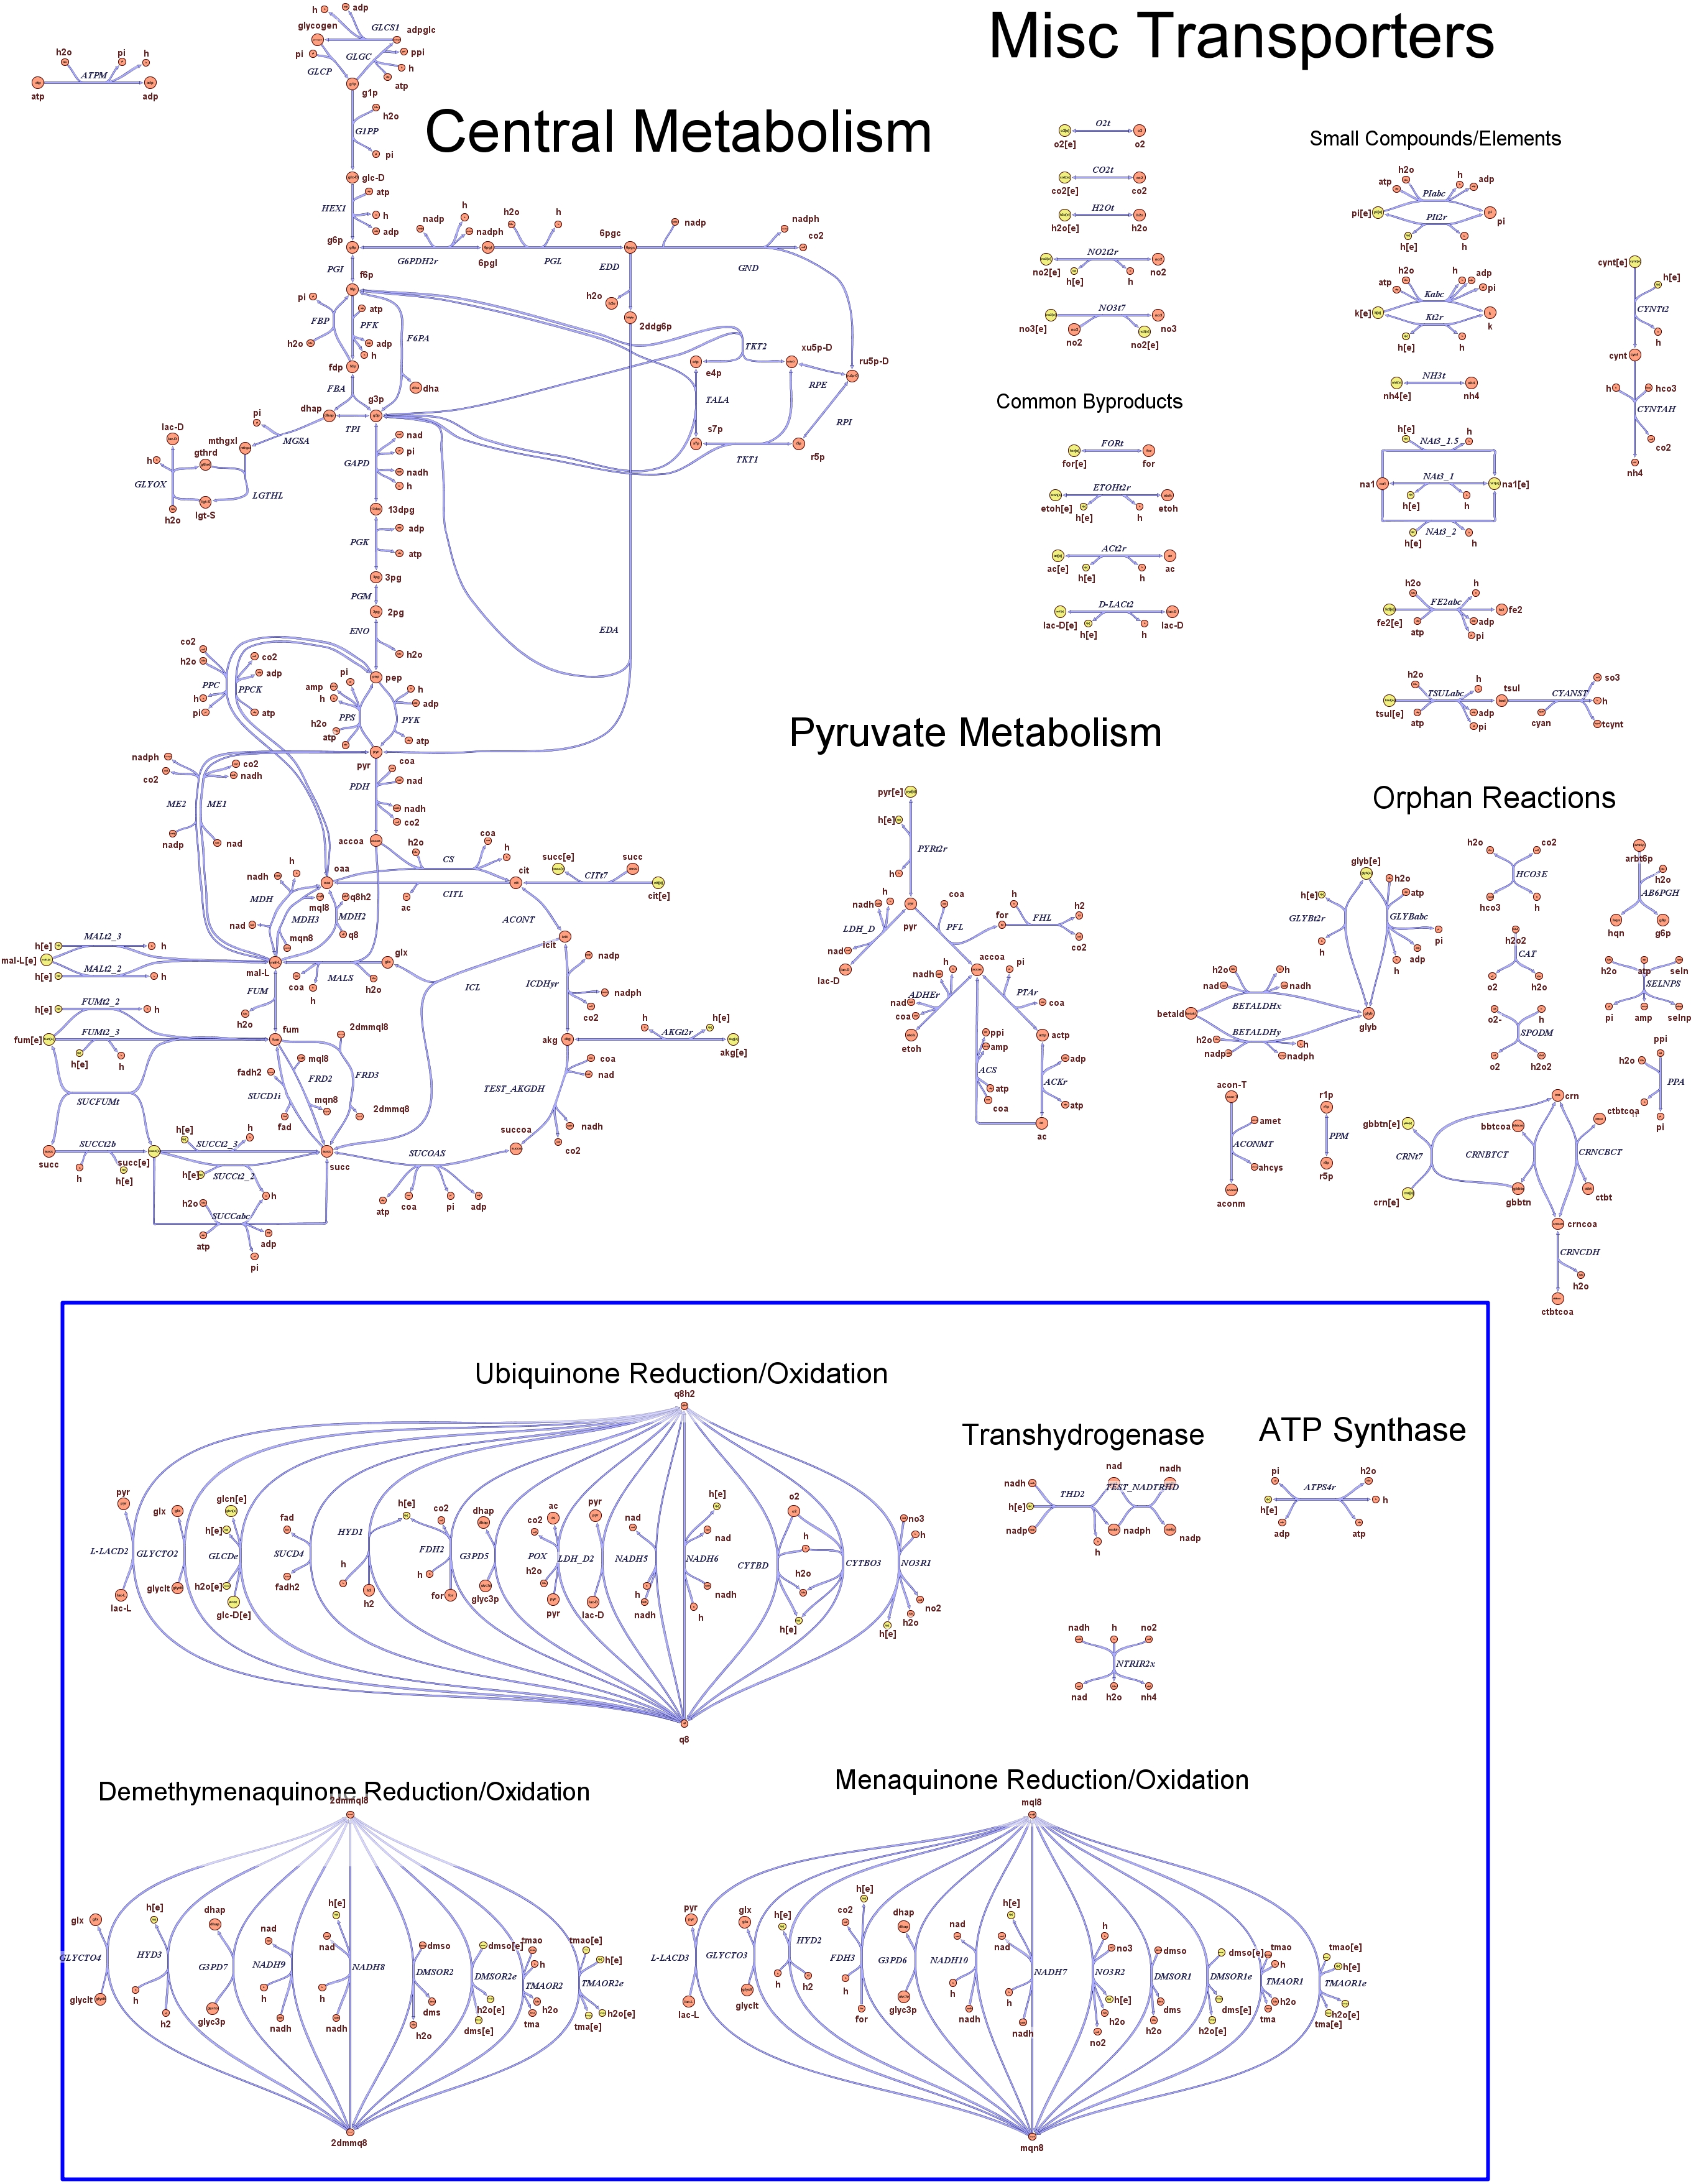
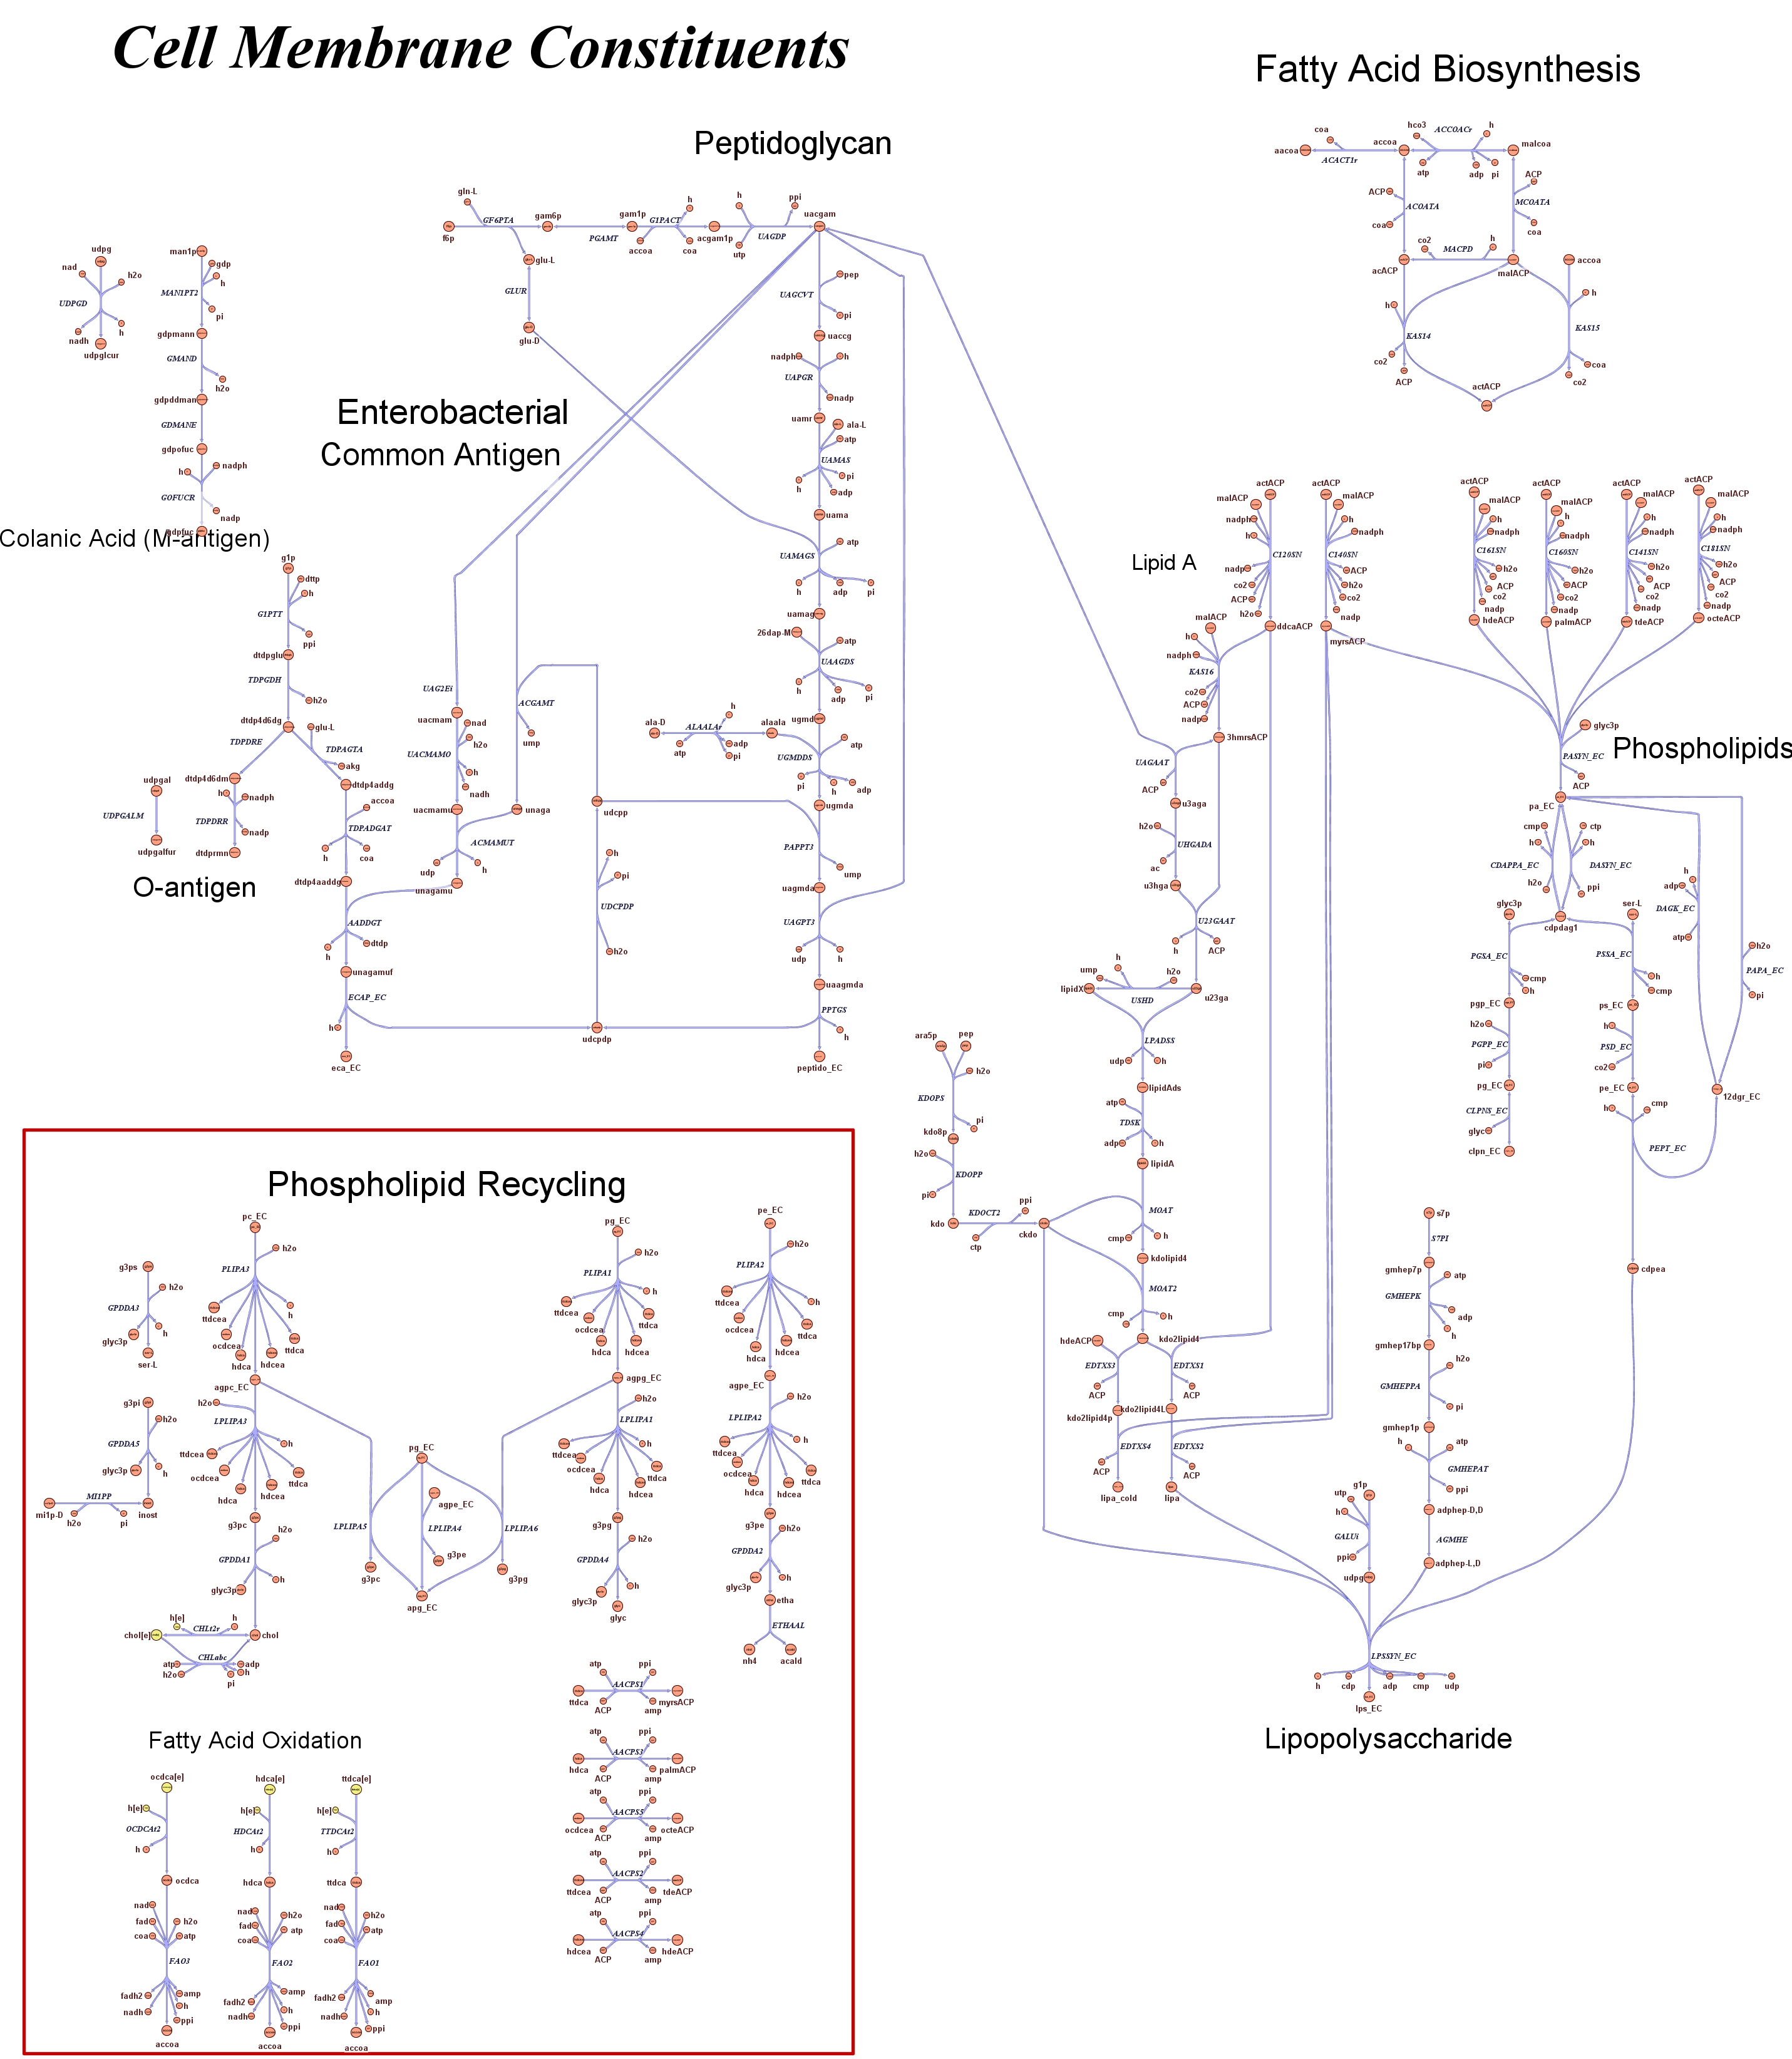
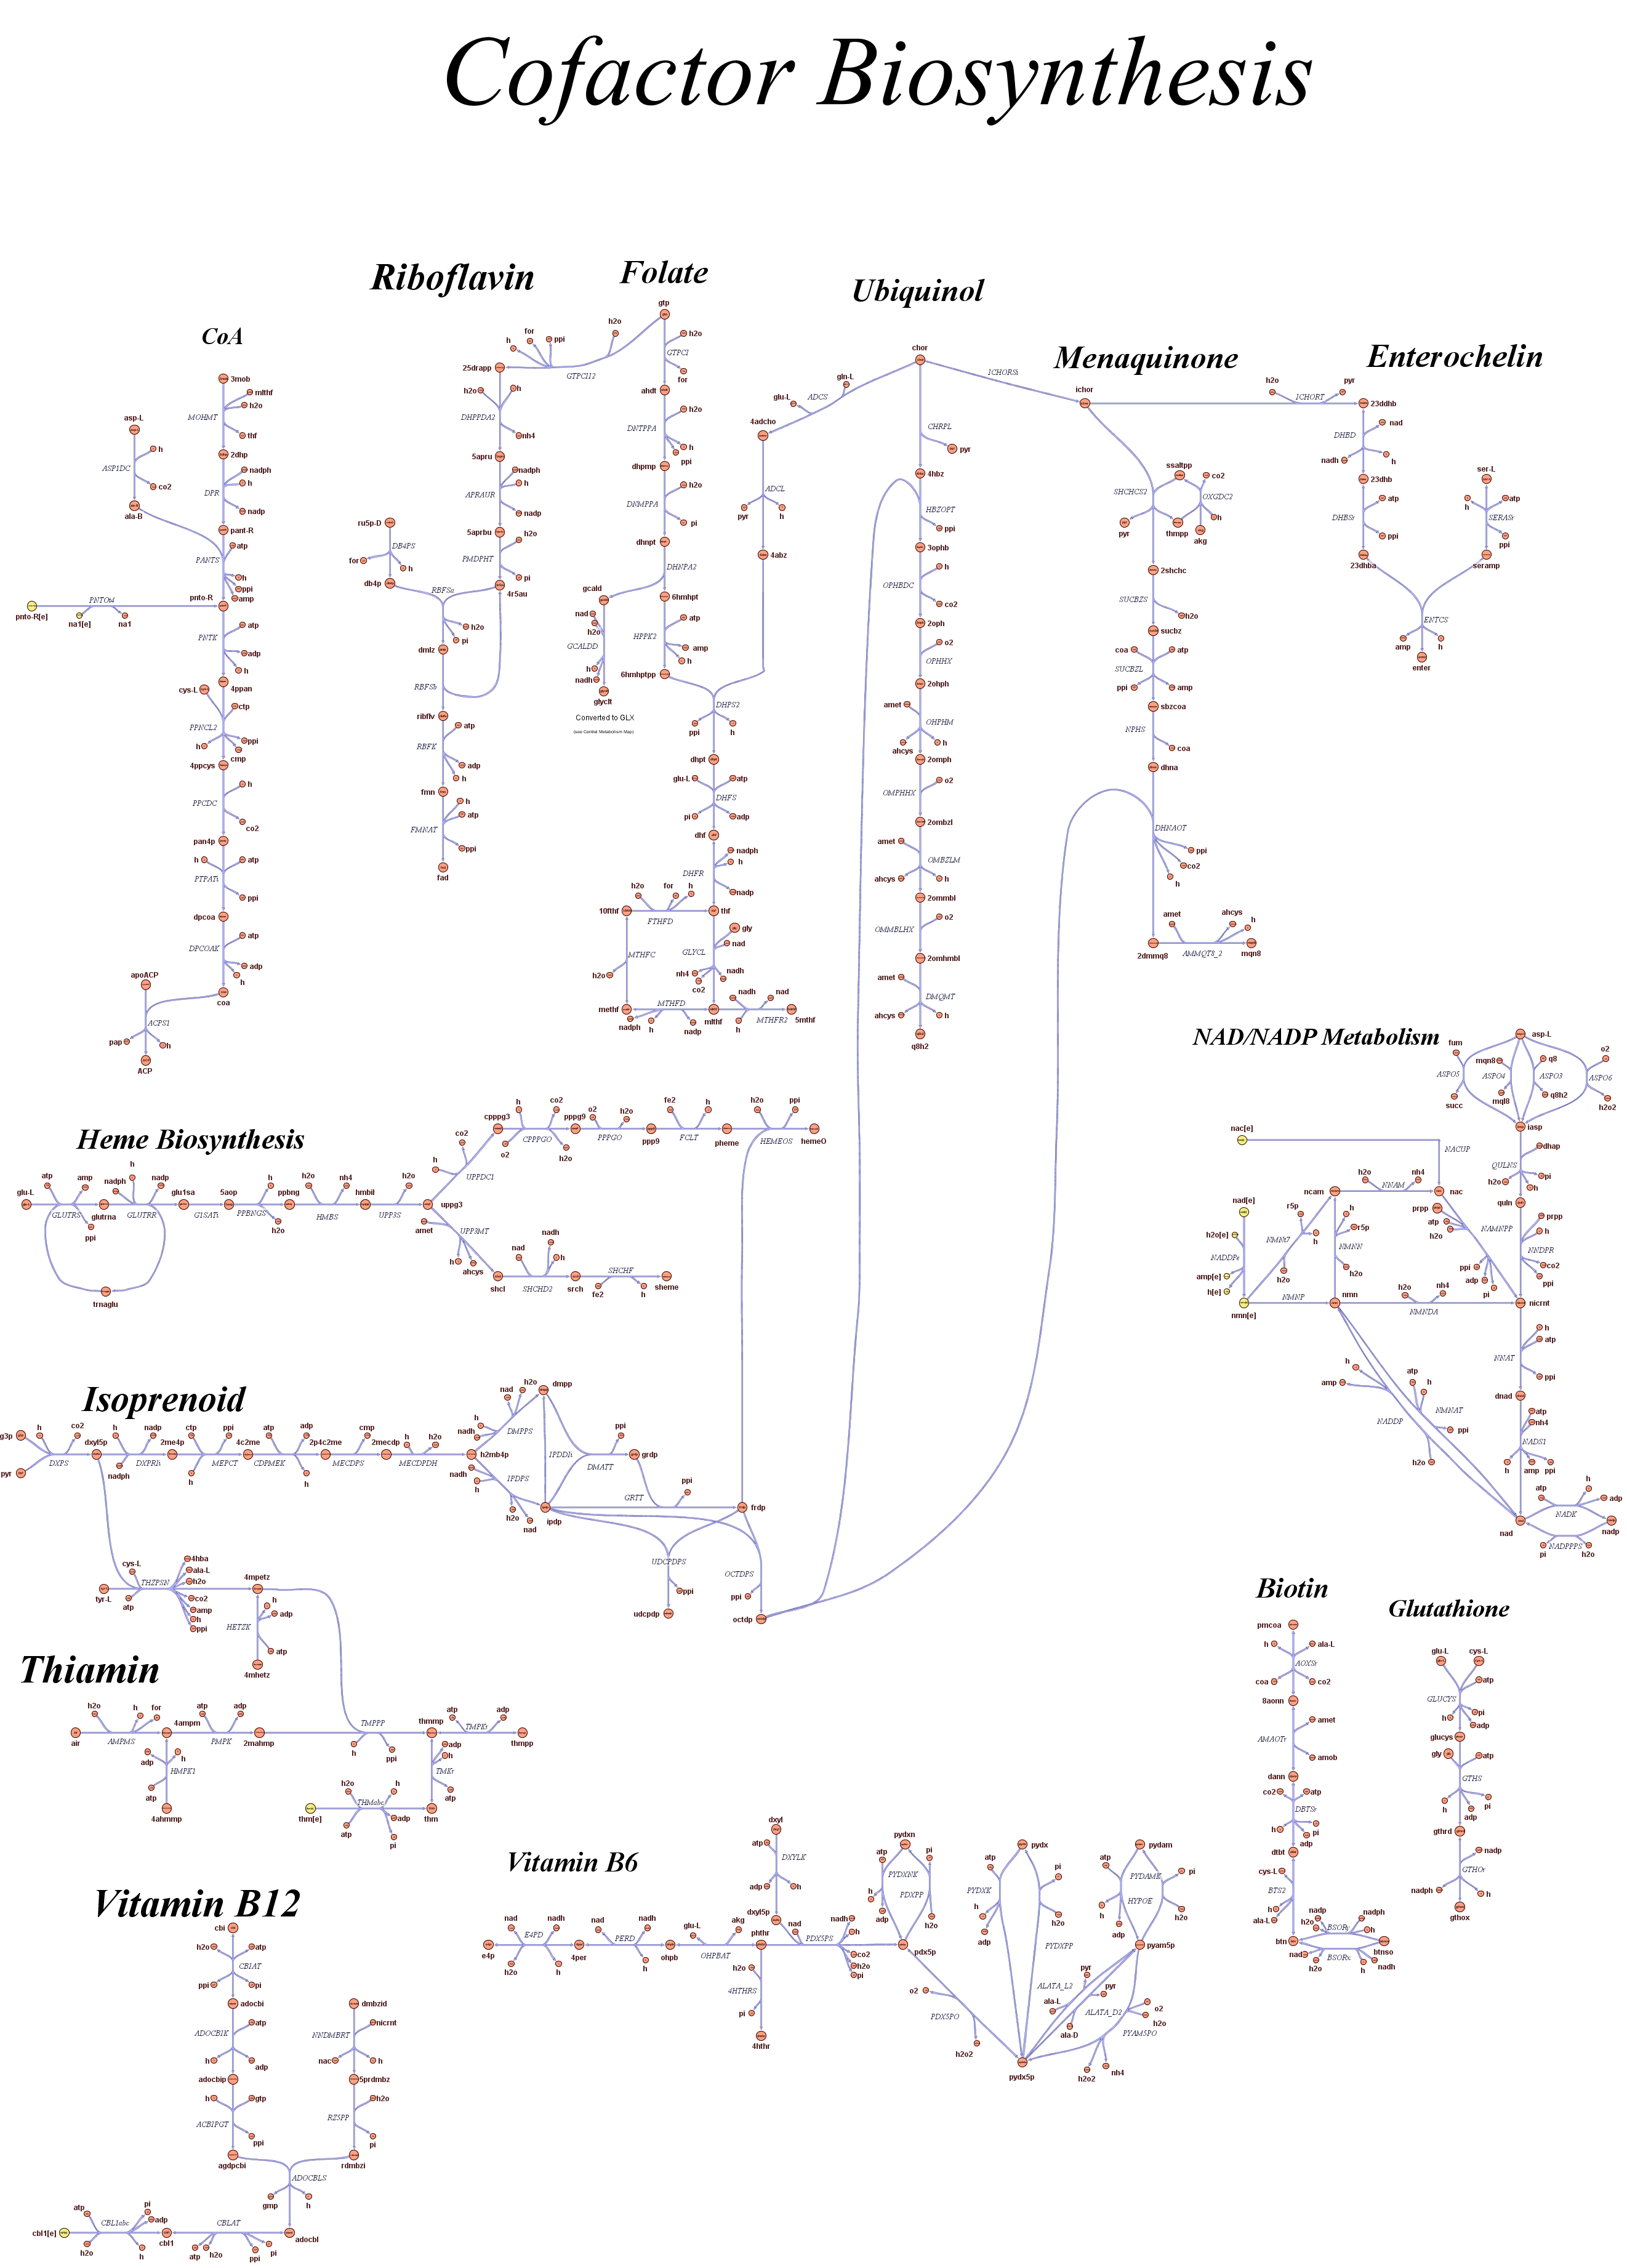
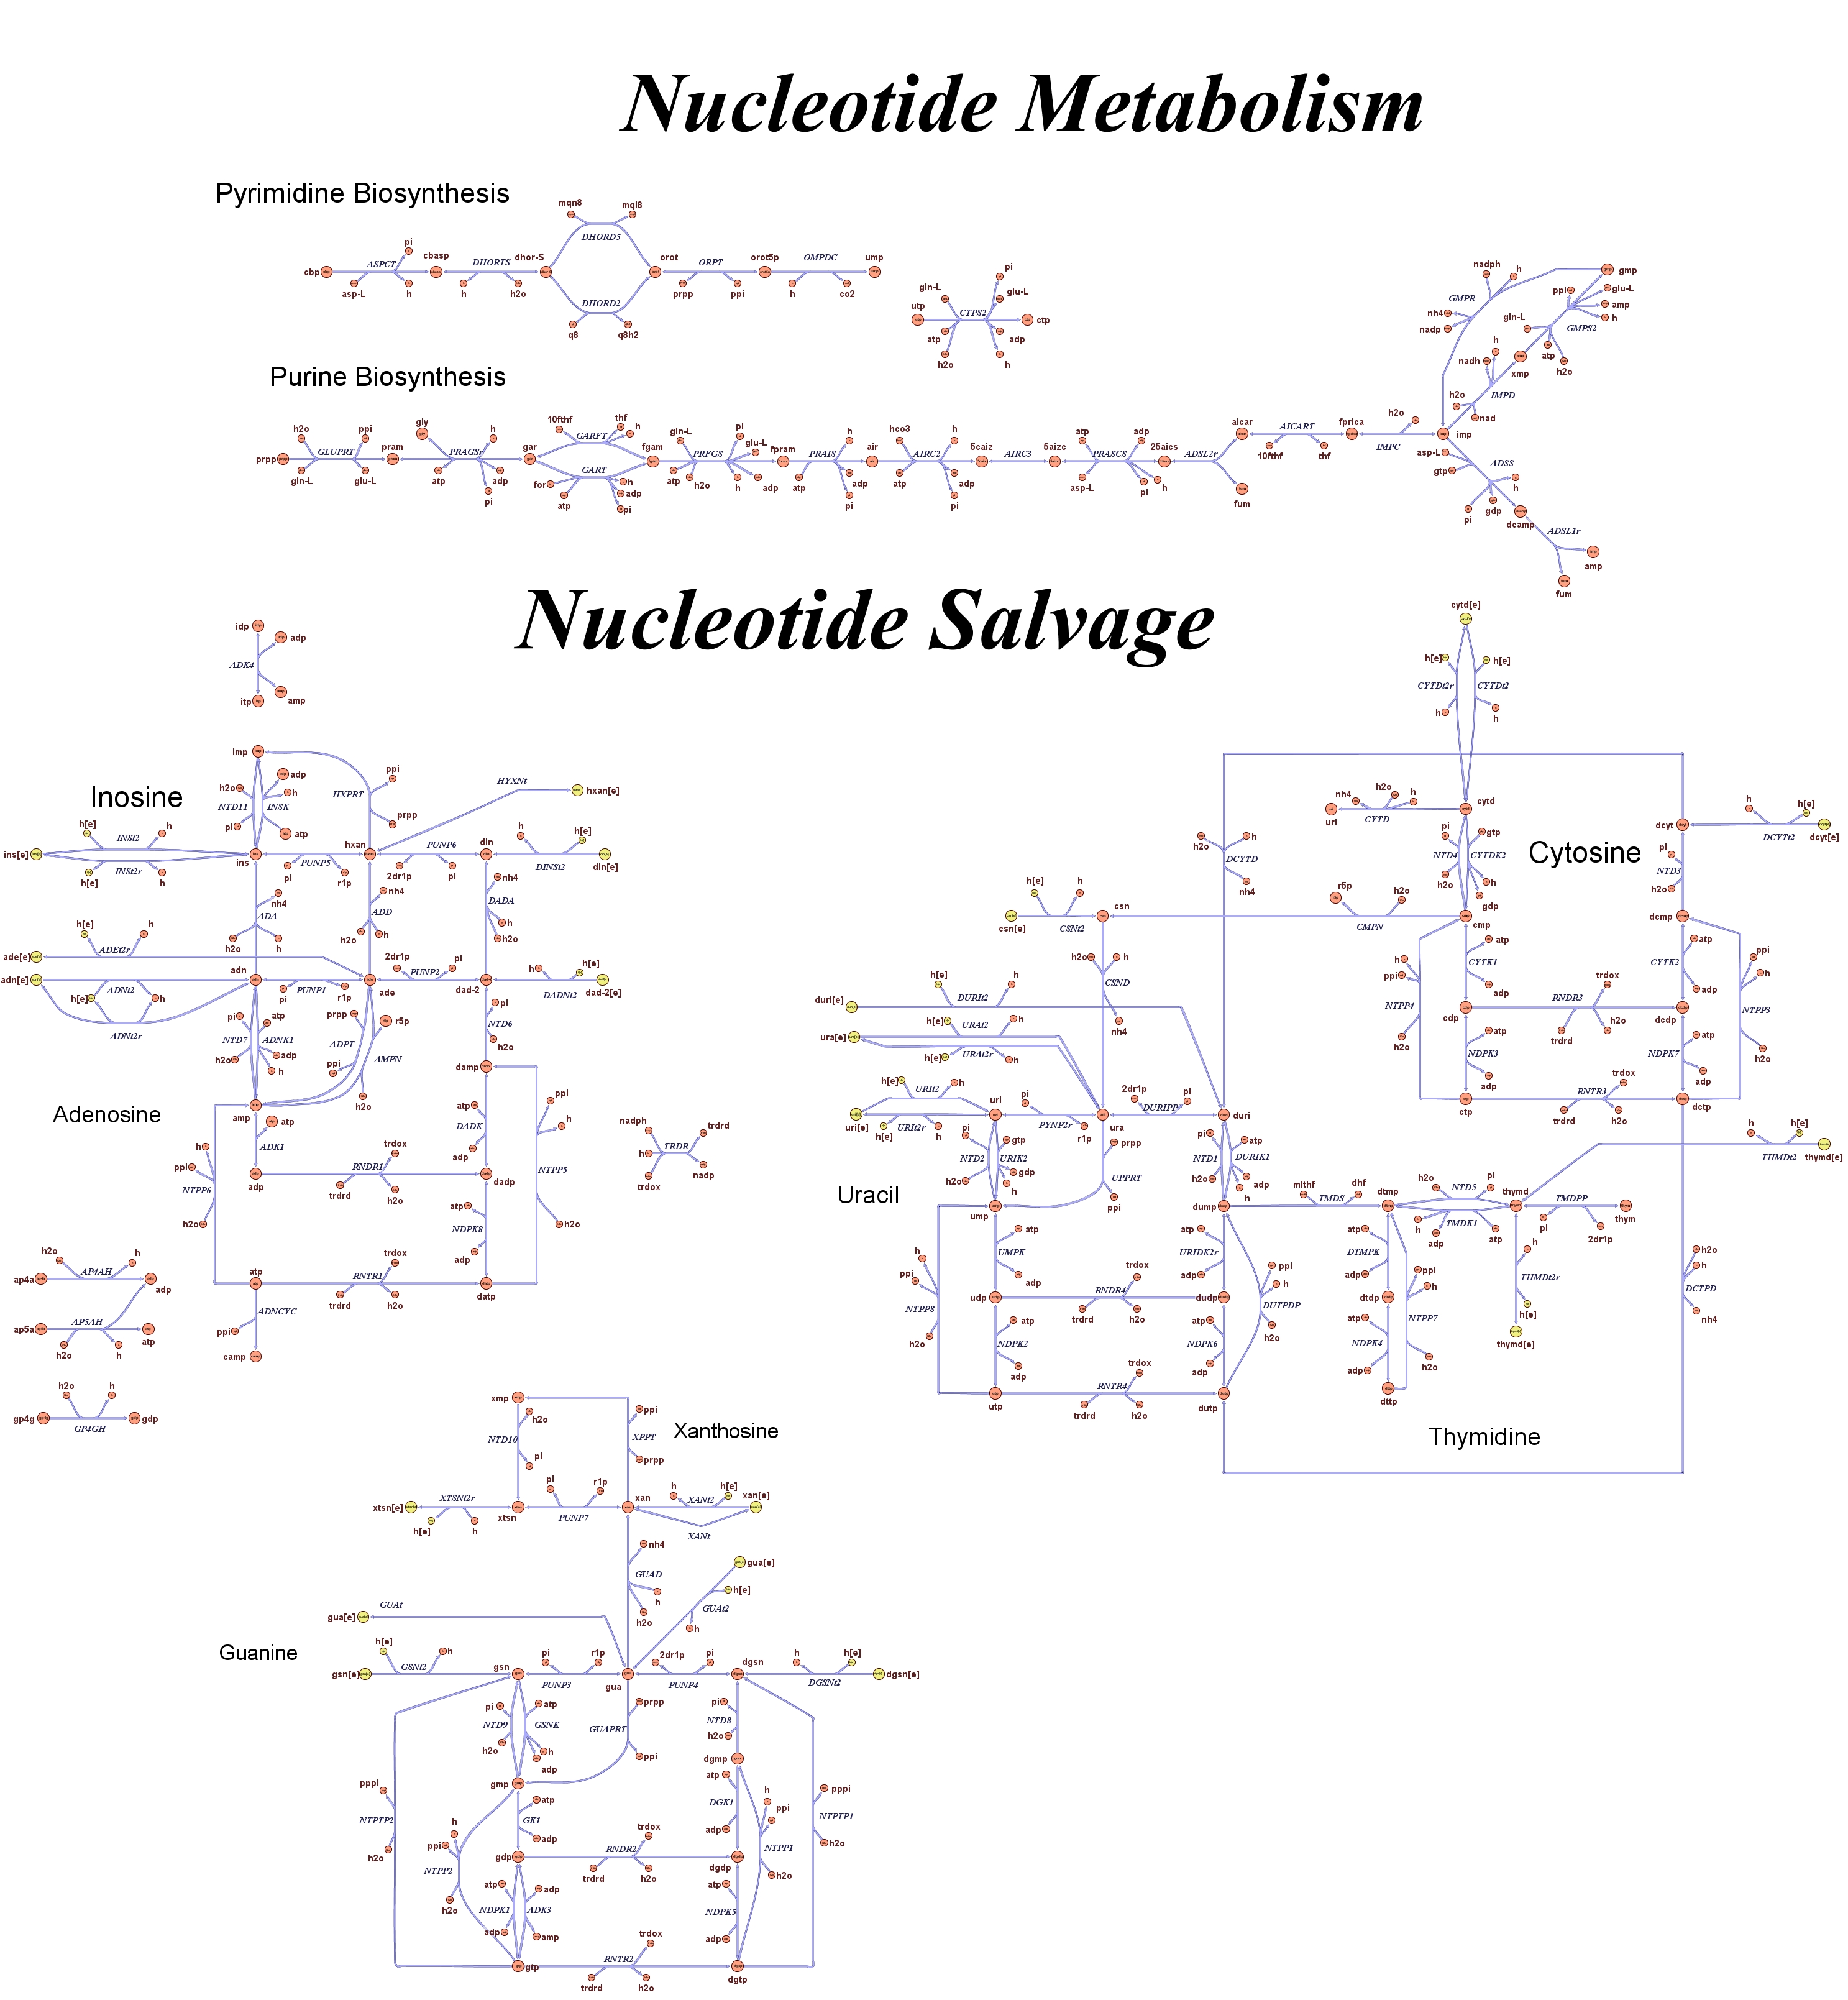
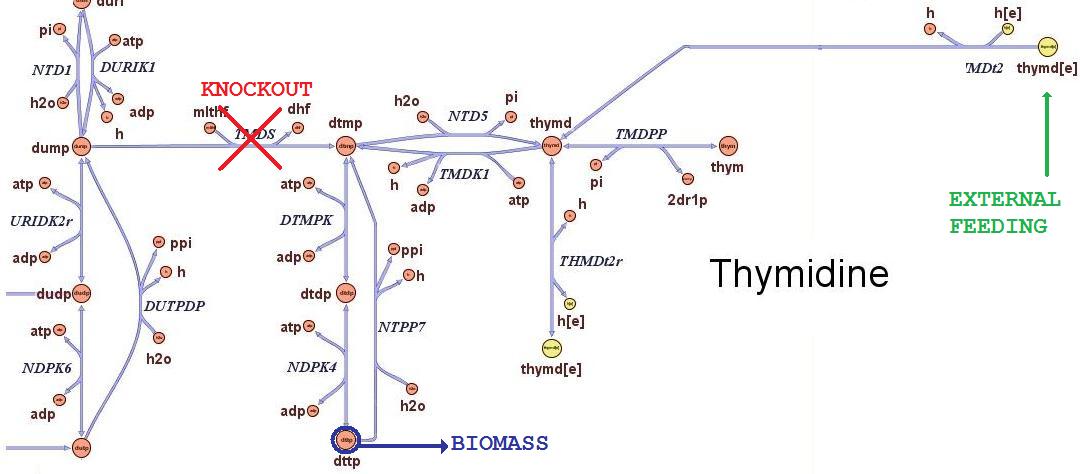
Then we performed growth simulations of the wild type strain and obtained maximal growth rate of 0.7367 in minimal medium and 1.1 in rich medium, in good accordance with experimental values. After having assessed this two possible conditions of growth, we can test how the cells will responsed to the different avaibility in nutrients. Thymidine limitation effects on growth ratesThe iAF1260 in-silico model mimics the metabolic network of a wild type E.Coli strain K12 MG1655. In order to simulate what is the cell response when thymidine auxotrophic and under a thymidine limitation, we modified the model by performing an in-silico knockouts of the THyA gene and introducing an external uptake reaction for thymidine. The picture below shows the modifications: The reaction termed TDMS is the thymidylate synthase reaction and has been removed from the model. The resulting model is non vital (growth rate is zero) for medium that do not contain nucleotides, according to experimental tests. The reaction TMDt2 has been set up to uptake a defined amount of thymidine from the medium. In this way the reaction that needs the nucleotides in order to produce biomass has a positive influx and rightly simulate cell growth.
Then we performed simulations varying the thymidine uptake rate of cells on two different background medium conditions, under minimal and rich medium. The plots below demonstrate that thymidine limitation can be used to control the maximum growth rate of cells.
Genome size effects on growth ratesGrowth rates as output of whole cell system behaviourComparing different approaches to minimal genomeReferences(1) "Thirteen Years of Building Constraint-Based In Silico Models of Escherichia coli" ,Jennifer L. Reed and Bernhard Ø. Palsson, Journal of Bacteriology, May 2003, p. 2692-2699, Vol. 185, No. 9 |
 "
"
