Optical Density
- Due to the nature of the Cell Lysis Cassette, Optical Densities can be used to determine when lysis has occurred. The R gene (endolysin) of the cassette degrades the cell wall. The solution becomes clear after lysis. After two to three hours, the Optical Density of the cell cultures dropped, signifying the expression of the S,R,Rz genes. The following graphs exhibit optical density trends during gene expression and resulting cell lysis and cell wall degradation. The first graph shows Optical Density as well as expected Resistance changes, which mirror Optical Density measurements. Resistance and Optical Density is expected to increase slightly within the first hour due to the continued cell growth after induction by .2% Arabinose.
Each culture was originally grown into the stationary phase and then diluted to the mid-log phase. The E. coli cells experience greatest growth in the Mid-Log phase. Arabinose was added while cells were in this phase which provided the quickest protein expression and resulting lysis.
Conductivity Testing
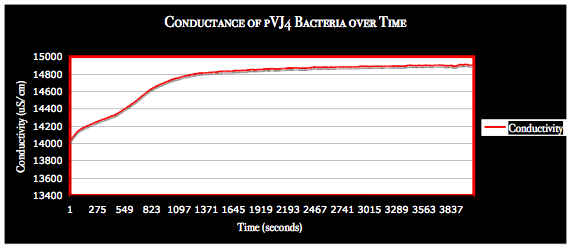
- Different from expected resistance measurements, the conductivity of the lysed solutions greatly increased.
|
 "
"


