Optical Density
In order to test the mechanism of the SRRz lysis cassette, we took optical density measurements as cell lysis occurred. The construct we used for testing was contained on the pVJ4 plasmid. This plasmid was obtained from the Mekalanos lab at HMS and contained the SRRz gene cassette in a pBAD18 plasmid.
Initially we introduced arabinose to the culture of cells and allowed the cultures to sit at room temperature for several hours and measured the optical density before and after the cells lysed. 0.2% arabinose by mass was added to the cultures.
 This data indicates that significant lysis occurs over a period of a few hours, confirming that the lysis cassette functions as predicted.
Next, we wanted to test the amount of time required for lysis to occur. We added 0.2% by volume of an arabinose stock solution to cell cultures and measured the optical densities of the cultures at certain distinct time points. The following graphs exhibit optical density trends during gene expression and resulting cell lysis and cell wall degradation. The first graph shows optical density and correlates that data to a predicted change in resistance that should occur as the cells lyse. Resistance and Optical Density is expected to increase slightly within the first hour due to the continued cell growth after induction by .2% Arabinose.
Optical density of the cell cultures significantly dropped between 1 and 2 hours after induction, signifying the expression of the lysis gene cassette. Notice that optical density increases slightly within the first hour of the test, due to continued cell growth before the lytic event. The predicted change in resistance reflects this period of cell growth.
Each culture was originally grown into the stationary phase and then diluted to the mid-log phase. The E. coli cells experience greatest growth in the Mid-Log phase. Arabinose was added while cells were in this phase which provided the quickest protein expression and resulting lysis.
NaCl Testing
- Multiple "Salt Tests" were performed to determine the exact sensitivity of our apparatus.
Salt concentrations originally tested are listed below. Further tests are to be run where the greatest resistance jump occurred to determine the exact concentration needed to see a significant resistance decrease due to cell lysis.
- .000005
- .00001
- .00005
- .0001
- .0005
- .001
- .005
- .01
- .05
- .1
Resistance Testing
- This test was done with 50X concentrated pVJ4 E. coli bacteria resuspended in M9 Minimal Media. Cultures were left overnight.
Conductivity Testing
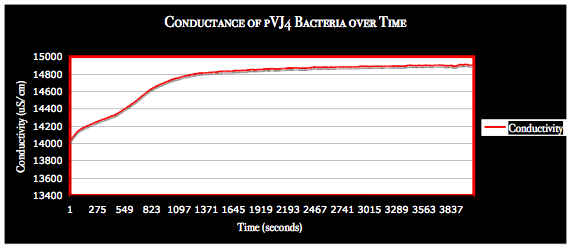
- Different from expected resistance measurements, the conductivity of the lysed solutions greatly increased. Initial conductivity tests were run one after the other due to the limited availability of conductivity probes. Team Toxipop now has access to two probes.
|
 "
"


