 "
"
Team:USTC/Results
From 2008.igem.org
(Difference between revisions)
(→Function Test) |
m (→Function Test) |
||
| Line 46: | Line 46: | ||
==Function Test == | ==Function Test == | ||
* '''A'''fter successfully cloning GFP(LVA),we want to test its function.We ligate it with lac promoter R0010,a strong RBS B0034 and teminator B0015. We transform the plasmid with these parts to E.coli strain TOP10 and induce the GFP express with 0.1mM IPTG. | * '''A'''fter successfully cloning GFP(LVA),we want to test its function.We ligate it with lac promoter R0010,a strong RBS B0034 and teminator B0015. We transform the plasmid with these parts to E.coli strain TOP10 and induce the GFP express with 0.1mM IPTG. | ||
| - | :::::[[Image:USTC-result1.jpg|left|300px|thumb| | + | :::::[[Image:USTC-result1.jpg|left|300px|thumb|Fig 7.Cells grow on the left plate generate GFP after IPTG induced,celles on the right plate is negtive control.]] |
| - | :::::::::::::::::::[[Image:USTC-result2.jpg|left|300px|thumb| | + | :::::::::::::::::::[[Image:USTC-result2.jpg|left|300px|thumb|Fig 8.Cells that generate GFP in fluorescence microscope ]] |
<br><br><br><br><br><br><br><br><br><br><br><br><br><br><br><br> | <br><br><br><br><br><br><br><br><br><br><br><br><br><br><br><br> | ||
Revision as of 10:19, 29 October 2008
 |
|---|
| Home | The Team | The Project | Components | Results | Parts Submitted to the Registry | Notebook |
|---|
Correlation between GFP expression and cell density
- In order to know how the expression amount of signal molecules is related to cell density, we use GFP as the intermediate variable between the two variables. First, we determined the function of GFP according to the population of bacteria. Here, we have constructed the part with BioBricks R0040 and E0840. After ligating them together, we measured the amount of GFP expression and corresponding OD values and then worked out the correlation curve using Origin 7.5.


- From the figures above, we can draw the conclusion that the expression of GFP generally takes on a linear function of OD when the OD600 is between 0.2 to 0.9.
Function Test
- After successfully cloning GFP(LVA),we want to test its function.We ligate it with lac promoter R0010,a strong RBS B0034 and teminator B0015. We transform the plasmid with these parts to E.coli strain TOP10 and induce the GFP express with 0.1mM IPTG.
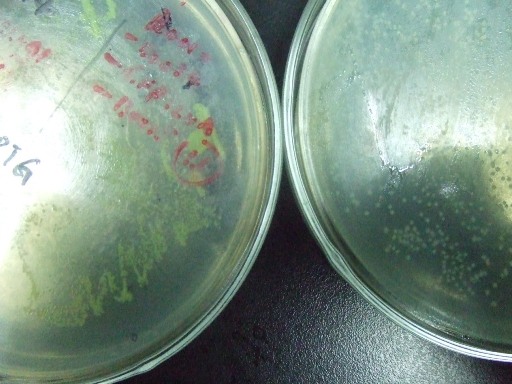 Fig 7.Cells grow on the left plate generate GFP after IPTG induced,celles on the right plate is negtive control.
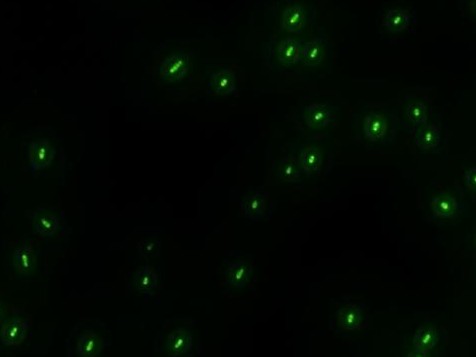 Fig 8.Cells that generate GFP in fluorescence microscope


- We have constructed some sequence with the purpose of testing whether the RNA polymerase can transcribe the target gene. For instance, we have built the following parts:
- R0040-B0034-C0070-E0840;
- R0040-B0034-K082004-E0840;
- R0071-E0840.
- As expected, the plasmid containing the first two sequence can generate green fluerescence while the view field is dark when the bacteria contain the third sequence.